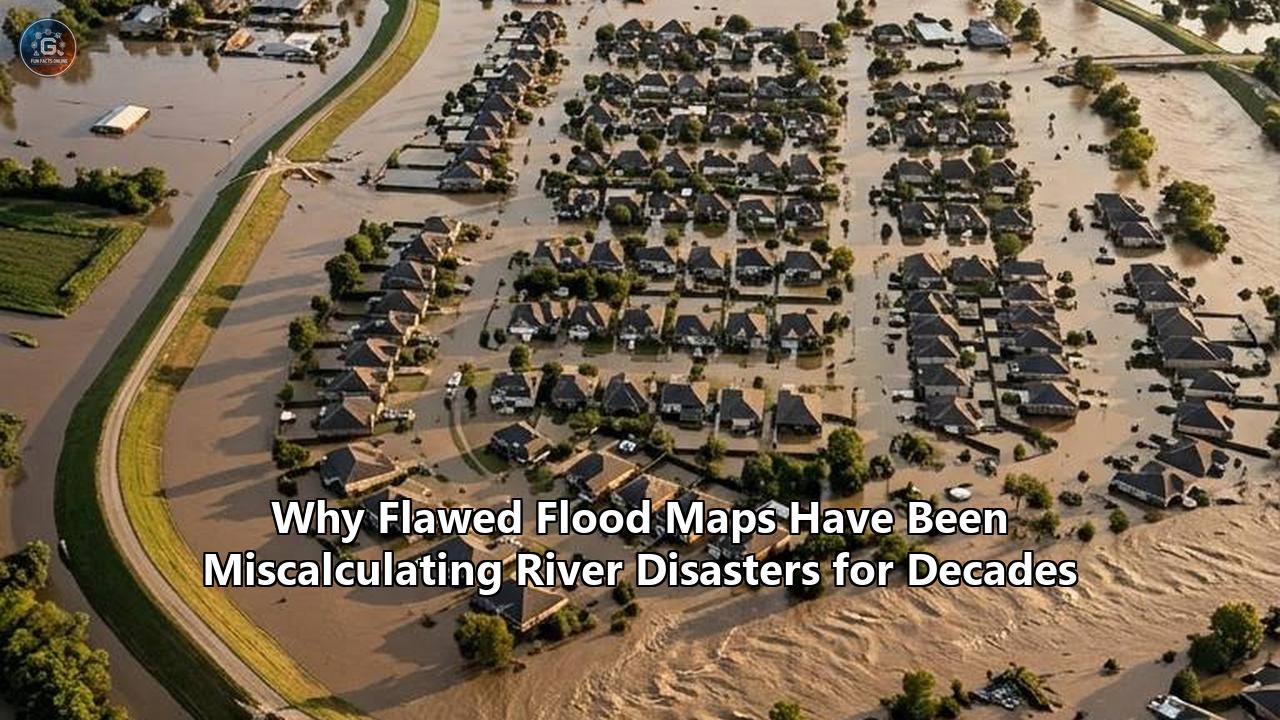
When the Swannanoa and French Broad rivers surged violently out of their banks, tearing century-old brick buildings from their footings and washing entire mountain neighborhoods down the Blue Ridge hollows, the disaster exposed a quiet structural failure that federal agencies, hydrologists, and civil engineers had spent years debating in technical white papers: the regulatory lines meant to warn Americans about drowning were fundamentally wrong.
In Buncombe County, North Carolina, home to Asheville and the hardest-hit mountain communities, approximately 2 percent of properties were designated within the Federal Emergency Management Agency’s (FEMA) high-risk Special Flood Hazard Areas (SFHA). Because federal law only mandates flood insurance for properties with federally backed mortgages inside that 1 percent annual chance boundary—the so-called 100-year floodplain—less than 1 percent of Buncombe County homeowners carried a National Flood Insurance Program (NFIP) policy when the water rose. The vast majority of the wreckage occurred in neighborhoods where official federal maps told mortgage lenders, municipal planners, and families that the river could not reasonably reach them.
The catastrophe in western North Carolina was not an isolated meteorological anomaly. In Augusta, Georgia, 51 percent of the inundation occurred outside federal high-risk zones. In Valdosta, an astounding 83 percent of flooded properties sat on land mapped as low-to-moderate risk. Across the country—from the narrow hollows of eastern Kentucky and the river valleys of Vermont to the sprawling flatlands of the Midwest—millions of Americans are living with a false sense of security engineered by a federal mapping apparatus designed in the 1960s.
                                  RIVER CROSS-SECTION: THE REGULATORY ILLUSION

   Actual 2D Hydrodynamic Surface (Extreme Convective/Compounded Runoff)
  ~~~~~~~~~~~~~~~~~~~~~~~~~~~~~~~~~~~~~~~~~~~~~~~~~~~~~~~~~~~~~~~~~~~~~~~~~~~~~~~~~~~~~~~~~~~~~~~~~~ [INUNDATED]
                 |                                                                   |
                 |       Official 1% Regulatory Water Surface Elevation (BFE)        |
                 |~~~~~~~~~~~~~~~~~~~~~~~~~~~~~~~~~~~~~~~~~~~~~~~~~~~~~~~~~~~~~~~~~~~|
                 |                                                                   |
                 |       +-------------------+               +-------------------+   |
                 |       | Home A (Zone AE)  |               | Home B (Zone X)   |   |
                 |       | Required to buy   |               | TOLD IT IS SAFE;  |   |
                 |       | Flood Insurance   |               | UNINSURED         |   |
                 |       +-------------------+               +-------------------+   |
                 |                 |                                   |             |
  _______________|_________________|___________________________________|_____________|_______________
  ///////// Regulatory Floodway /////////|/////////// Mapped 100-Year Floodplain ////////////| Unmapped Upland
                                         |                                                   |
                             Active River Channel                                 Unmapped Pluvial Runoff
Behind the scenes of these recurring tragedies lies a compounding systemic breakdown. The crisis of inaccurate flood maps is not merely a matter of bureaucratic delay or underfunded agency budgets. It is the product of an outdated mathematical architecture, deliberate statutory exclusions, hydraulic modeling simplifications that ignore basic laws of fluid dynamics, and intense local political pressures that incentivize the systematic erasure of flood risk from municipal tax bases.
The Stationarity Fallacy: Hydrologic Mathematics Trapped in the Past
To understand why federal flood projections fail, one must examine the mathematical baseline on which every Flood Insurance Rate Map (FIRM) is constructed: flood frequency analysis. For more than five decades, federal hydrologic engineering has operated on a foundational assumption known as stationarity.
Stationarity posits that natural water systems fluctuate within an unchanging envelope of variability. Under this doctrine, the probability distribution of future extreme streamflows is assumed to be identical to the historical record. If a river basin experienced three major peak-discharge events between 1940 and 1990, hydrologists assume those fifty years of gauge records provide an accurate statistical blueprint for the next fifty years.
       HISTORICAL RECORD (1940–1990)                   PROJECTED FUTURE (NON-STATIONARY)
   [Mean & Variance Assumed Constant]                 [Upward Shift in Mean & Variance]

  Discharge (cfs)                                    Discharge (cfs)
      ^                                                  ^
      |      *           *                               |            *        *     *   <-- New 1% Peak
      |   *     *     *     *                            |         *     *  *     *
  ----+---------------------------> Time             ----+---------------------------> Time
        Stationary "100-Year" Peak                         Historical 100-Year Line Breached
Federal agencies calculate the 1 percent annual exceedance probability (AEP) flood—the "100-year flood"—using guidelines published by the Interagency Advisory Committee on Water Data. For decades, the standard was Bulletin 17B, first published in 1982, superseded in 2018 by USGS Bulletin 17C. Both frameworks fit annual peak streamflow data to a Log-Pearson Type III (LP3) probability distribution using the Method of Moments:
$$\log(Q) = \bar{X} + K(S, G)$$
Where:
- $\bar{X}$ is the mean of the logarithms of annual peak flows.
- $S$ is the standard deviation of the logarithmic flows.
- $G$ is the skew coefficient, measuring the asymmetry of the flood frequency distribution.
- $K$ is a frequency factor determined by the skew coefficient and the target recurrence interval.
While Bulletin 17C introduced the Expected Moments Algorithm (EMA) to better accommodate historical flood thresholds, paleoflood data, and censored low-flow records, the core guidance explicitly acknowledges a fatal limitation: the standard statistical equations do not apply to watersheds subject to hydrologic non-stationarity or shifting rainfall trends.
The physical atmosphere violates stationarity every day. The Clausius-Clapeyron relation dictates that for every 1 degree Celsius increase in atmospheric temperature, air holds approximately 7 percent more water vapor. When convective storms stall over river basins, they drop moisture volumes that dwarf the historical peak flows cataloged in mid-twentieth-century streamgage logs.
Compounding the problem, the precipitation frequency baselines feeding these streamflow models are decades out of date. Most FEMA river studies rely on the National Oceanic and Atmospheric Administration's (NOAA) Atlas 14 precipitation frequency estimates. Across vast portions of the United States, Atlas 14 relies on rain gauge data that terminates in the late 1990s or early 2000s.
NOAA is developing NOAA Atlas 15 to account for temporal trends and climate model projections through 2100. The phased rollout of preliminary data for the contiguous United States marks a critical shift toward non-stationary modeling. However, translating new atmospheric precipitation data into finished, legally enforceable FIRMs takes an average of five to seven years per watershed. As a result, engineers are actively designing infrastructure and mapping river hazards using hydrologic frequency tables calibrated to a climate that no longer exists.
1D Cross-Sections vs. 2D Hydrodynamics: The Physics FEMA Left Out
Once hydrologists determine the discharge volume—measured in cubic feet per second (cfs)—that represents a 1 percent annual chance event, the data is handed to hydraulic engineers. The engineer’s job is to translate that volume into a physical water surface elevation (Base Flood Elevation, or BFE) and draw a horizontal boundary line on a map.
For more than forty years, the primary computational engine for this work was the U.S. Army Corps of Engineers' HEC-2 program, succeeded by the one-dimensional (1D) module of the Hydrologic Engineering Center's River Analysis System (HEC-RAS). To this day, the overwhelming majority of effective river flood maps across the United States remain legacy 1D steady-state hydraulic models.
                     ONE-DIMENSIONAL (1D) STEADY-STATE MODELING
  Cross-sections (CS) sliced perpendicular to channel. Assumes water flows only down-valley.

  [CS 1] ======================================== (Water level calculated as a flat plane)
                       |
                       v
  [CS 2] ======================================== (Ignores lateral flow into side depressions)
                       |
                       v
  [CS 3] ======================================== (Fails to capture split flows or backwater loops)

  -----------------------------------------------------------------------------------------
                     TWO-DIMENSIONAL (2D) UNSTEADY SHALLOW WATER MESH
  Continuous flexible grid (e.g., 10x10 ft cells). Resolves true velocity vectors and ponding.

         +----+----+----+----+----+
         | -> | -> | \/ | <- | <- |   Full solution of Saint-Venant equations:
         +----+----+----+----+----+   Captures dynamic wave propagation, bridge choking,
         | -> | \\ | \/ | // | <- |   embankment breakouts, and direct rainfall (Rain-on-Grid).
         +----+----+----+----+----+
The Limitations of 1D Backwater Calculations
In a 1D model, an engineer slices a river valley into a series of static cross-sections perpendicular to the flow path. The software calculates water surface elevations between cross-sections by solving the one-dimensional energy equation with the standard step method:
$$z_2 + Y_2 + \frac{\alpha_2 V_2^2}{2g} = z_1 + Y_1 + \frac{\alpha_1 V_1^2}{2g} + h_e$$
Where:
- $z$ is the invert elevation of the channel.
- $Y$ is the depth of water.
- $V$ is the average velocity.
- $\alpha$ is the velocity weighting coefficient.
- $g$ is gravitational acceleration.
- $h_e$ represents energy head loss, calculated from friction losses (Manning’s equation) and expansion/contraction losses.
The 1D approach assumes water moves solely in a single direction: parallel to the primary channel centerline. It assumes that velocity across each cross-section is uniform or cleanly segmented, that water surface elevations across a floodplain are completely flat perpendicular to the river, and that flow rates remain steady over time.
Real floodwaters do not behave this way. During extreme riverine disasters:
- Water spills out of the main channel and flows laterally down secondary roadbeds, railroad tracks, and natural depressions that run at oblique angles to the main stem.
- Overbank flows encounter infrastructure obstacles—such as highway berms, bridge abutments, and culverts—becoming impounded and creating temporary reservoirs before blowing out in violent wave pulses.
- High-velocity flows shed dynamic eddies and reverse-direction backwaters that standard 1D cross-sections cannot calculate.
When an engineer models a complex river valley in 1D, they must manually define cross-section lines and assign subjective flow path lengths. If the engineer positions a cross-section incorrectly, or fails to anticipate where water will leave the river corridor, the model under-predicts the lateral spread of the flood.
The 2D Hydrodynamic Alternative
By contrast, modern two-dimensional (2D) hydrodynamic models—such as HEC-RAS 2D, TUFLOW, and InfoWorks ICM—solve depth-averaged Navier-Stokes equations (the 2D Shallow Water Equations) across continuous computational meshes composed of millions of cells. The 2D Saint-Venant continuity and momentum equations account for both horizontal velocity components ($u$ and $v$):
$$\frac{\partial h}{\partial t} + \frac{\partial (hu)}{\partial x} + \frac{\partial (hv)}{\partial y} = q$$
$$\frac{\partial (hu)}{\partial t} + \frac{\partial (hu^2 + \frac{1}{2}gh^2)}{\partial x} + \frac{\partial (huv)}{\partial y} = - gh \frac{\partial z_0}{\partial x} - \frac{\tau_{bx}}{\rho}$$
$$\frac{\partial (hv)}{\partial t} + \frac{\partial (huv)}{\partial x} + \frac{\partial (hv^2 + \frac{1}{2}gh^2)}{\partial y} = - gh \frac{\partial z_0}{\partial y} - \frac{\tau_{by}}{\rho}$$
These equations allow water to move in any direction based entirely on physical topography, gravity, and friction.
Despite HEC-RAS 2D being publicly available since 2016, FEMA’s regulatory mapping inventory has transitioned at a glacial pace. The agency only released formal technical guidance allowing 2D floodway encroachment modeling in recent software updates (such as HEC-RAS version 6.4.1). Because running 2D unsteady flow simulations requires orders of magnitude more computational power and significantly higher surveying costs, private engineering contractors working on FEMA mapping updates routinely defaulted to legacy 1D steady-state approaches to stay within fixed federal budget caps. The result is a regulatory library dominated by inaccurate flood maps that flatten complex hydrodynamic disasters into simplified, linear abstractions.
The Pluvial Blind Spot and Headwater Drainage Cutoffs
One of the largest structural deficiencies in federal flood mapping is the institutional distinction between fluvial (riverine) and pluvial (rainfall-driven surface) flooding.
FEMA’s statutory mandate under the National Flood Insurance Act of 1968 focuses on riverine and coastal hazards. Under standard operating guidelines for the Risk MAP (Mapping, Assessment, and Planning) program, the agency rarely models or maps streams with contributing drainage areas of less than 1 square mile (640 acres).
                                  THE 1-SQUARE-MILE MAPPING VOID

       [Upstream Headwater Gully]               [Mid-Basin Tributary]            [Main Stem River]
          Drainage: 0.4 sq mi                      Drainage: 1.2 sq mi              Drainage: 45 sq mi

        ========================                 ========================         ========================
        NO FEMA MAPPING PRODUCED                 APPROXIMATE STUDY ONLY           DETAILED 1D/2D STUDY
        - Unstudied (Zone X)                     - No BFEs Established (Zone A)   - BFEs Established (Zone AE)
        - Zero Insurance Mandates                - Approximate Outlines           - Regulatory Floodway Mapped
        ========================                 ========================         ========================
                    |                                       |                                 |
                    v                                       v                                 v
        [Flash Floods & Debris Flows             [Moderate Flow Calculated;       [High-Density Mapped Zone;
         Devastate Unaware Homes]                 Ignored Compound Rain Runoff]    Miscalculates Pluvial Water]
In mountainous, hilly, or heavily urbanized terrain, this 1-square-mile threshold blinds the mapping system to extreme hazard zones. Steep headwater gullies and first-order tributaries routinely catch torrential precipitation and convert it into high-velocity flash floods laden with sediment, boulders, and woody debris before the water ever reaches a federally mapped river channel.
| Metric / Parameter | Traditional FEMA FIRM Study | Advanced Catastrophe / 2D Model |
|---|---|---|
| Minimum Drainage Area | Typically 1.0 sq. mile (640 acres) | Basin-wide down to parcel level (no minimum) |
| Pluvial (Direct Rain) Inclusion | Excluded (assumes water starts in stream) | Included via direct Rain-on-Grid simulation |
| Hydraulic Dimensionality | Predominantly 1D Steady State | 2D Unsteady Shallow Water Equations |
| Precipitation Data | Static Historical (NOAA Atlas 14) | Dynamic / Non-Stationary (Atlas 15 / GCMs) |
| Mapping Mechanism | Binary (Inside or Outside the 1% Line) | Probabilistic & Depth-Damage Continuous |
| Future Land-Use Changes | Excluded by regulatory statute | Integrated via future land-cover scenarios |
When Hurricane Helene struck western North Carolina, or when catastrophic floods swept eastern Kentucky and central Vermont, thousands of homes were obliterated along unmapped zero-order swales and first-order creeks. Because the upstream drainage basin was smaller than 640 acres, these waterways did not exist on official Flood Insurance Rate Maps. On paper, the surrounding parcels were designated Zone X—low-to-moderate risk—exempt from elevation requirements and mandatory insurance.
Furthermore, FEMA maps completely decouple pluvial surface accumulation from riverine baseflow. Traditional hydraulic modeling assumes that precipitation falls across a watershed, runs through a hydrologic routing equation, and enters the upstream boundary of a river cross-section as a clean discharge hydrograph. In reality, during extreme meteorological events, direct rainfall ponds over local terrain and saturates the built environment hours before the river crests.
When rainfall cannot infiltrate waterlogged soil or drain through undersized stormwater networks, pluvial flooding submerges communities located well above the river’s Base Flood Elevation. Because FEMA FIRMs do not map pluvial inundation, millions of urban and suburban property owners are unaware that their street functions as an overland storm drainage channel during high-intensity rain events.
Topographical Blind Spots and Manning’s Roughness Errors
Hydraulic models are only as accurate as the digital elevation models (DEMs) and surface roughness values fed into their computational grids. For decades, vast swaths of the United States were mapped using coarse 10-meter or 30-meter elevation contours digitized from vintage USGS quadrangle maps created in the mid-twentieth century.
                          ELEVATION ERROR VS. FLOODPLAIN SPREAD

   Vertical Error: +/- 2.0 ft in Coarse DEM (1970s Quadrangle)

       False Elevation Profile               True LiDAR Terrain Profile
       -----------------------               --------------------------
                  |                                      |
                  v                                      v
  ================================= BFE   ================================= BFE
                 / \                                    /                 \
                /   \                                  /                   \
               /     \                                /                     \
              /       \                              /                       \
             / MAPPED  \                            /      ACTUAL FLOOD       \
            / FLOODPLAIN\                          /          SPREAD           \
           /             \                        /                             \
  ========+---------------+=======       ========+-------------------------------+========
             Spread: 100 ft                               Spread: 650 ft
             [Underestimates exposed structures by 550%, leaving homes unmapped]
A vertical elevation error of just one to two feet in a flat agricultural basin or coastal plain can shift the horizontal delineation of a floodplain boundary by hundreds—or even thousands—of feet. While USGS’s 3D Elevation Program (3DEP) has dramatically expanded high-resolution airborne LiDAR (Light Detection and Ranging) coverage over the last decade, thousands of rural river miles still rely on outdated approximate studies (Zone A) where floodplains were sketched manually without survey-grade terrain models.
Beyond topography, the calculation of river stages is acutely sensitive to hydraulic resistance, expressed in Manning’s roughness coefficient ($n$). In Manning’s open channel equation:
$$V = \frac{k}{n} R_h^{2/3} S^{1/2}$$
Where:
- $V$ is mean flow velocity.
- $k$ is a conversion factor ($1.486$ for U.S. customary units).
- $n$ is Manning’s roughness coefficient.
- $R_h$ is the hydraulic radius (cross-sectional area divided by wetted perimeter).
- $S$ is the energy slope of the flow.
Manning's $n$ is not a physical constant; it is an empirical value selected by the engineer. A smooth, concrete-lined drainage channel may have an $n$ value of $0.013$, while an open, clean natural stream may be $0.035$, and a dense, brush-choked floodplain can exceed $0.120$.
                 MANNING'S ROUGHNESS ($n$) ESTIMATION DISCREPANCIES

  Assumed Static State (Pre-Development Model):
  Overbank: Dense brush/trees (n = 0.100) -> Higher resistance, slower velocity, higher stage locally.

  Actual Evolving Watershed (Suburbanization/Channel clearing):
  Overbank: Cleared lawns & asphalt (n = 0.025) -> Low resistance, extreme velocity.

  The Downstream Bottleneck Shock:
  Water flushes rapidly off cleared upstream land and piles up at downstream bottlenecks,
  overtopping BFEs that were calibrated to uniform, static roughness assumptions.
In traditional flood insurance studies, engineers select static $n$ values from standard reference tables compiled in the 1950s and 1960s (such as Chow’s Open-Channel Hydraulics). They rarely calibrate these values against multiple real-world historic storm stages because high-water mark records are sparse on un-gauged streams. If an engineer underestimates Manning’s $n$ on the overbanks, the mathematical model artificially accelerates water velocities and lowers the predicted flood elevation.
Conversely, when rapid land-use changes occur—such as commercial strip developments, golf courses, or dense suburban developments stripping natural riparian forest buffers—the actual hydraulic roughness of the valley changes overnight. Upstream runoff accelerates, slamming into downstream bridge choke points and generating water surface elevations that far exceed the static numbers printed on FEMA’s effective maps.
The Political and Regulatory Machinery of Floodplain Shrinkage
The systemic inaccuracies of American flood maps cannot be explained by physics and mathematics alone. Flood mapping is inherently political. The process through which a raw hydrodynamic model becomes a legally binding Flood Insurance Rate Map contains multiple intervention points where economic incentives consistently push flood boundaries backward, away from developable land.
                    HOW RAW SCIENCE IS FILTERED INTO REGULATORY MAPS

  [ Raw Hydrodynamic Science ]
  - 2D Unsteady Rain-on-Grid Simulations
  - Dynamic Non-Stationary Precipitation (Atlas 15)
  - True Basin Hazard Delineation
                |
                v
  [ Statutory & Budget Scoping ]
  - Exclude drainage areas < 1 sq mile
  - Drop pluvial/direct rainfall components
  - Mandate static historical gauge data (Bulletin 17C stationarity)
                |
                v
  [ Municipal & Developer Review (The 90-Day Appeal Process) ]
  - City challenges draft maps to prevent property tax devaluations
  - Consulting engineers tweak Manning's n and cross-section angles
  - MT-2 Process: LOMR-Fs submitted to remove parcels using dirt fill
                |
                v
  [ 44 CFR 65.10 Levee Accreditation ]
  - Levees meeting "100-year + 3ft freeboard" standard hide inland hazard
  - Land behind certified levee mapped as Zone X (Zero Insurance Mandate)
                |
                v
  [ Final Effective FIRM ]
  --> Shrunken High-Risk Zones; False Sense of Security; Underinsured Communities
The Local Tax Base Dilemma
When FEMA initiates a map update under its Risk MAP program, it produces preliminary FIRMs and delivers them to municipal and county governments. Under federal law, these draft maps enter a mandatory 90-day statutory appeal and comment period.
For a local mayor, city manager, or county commissioner, an expanded 100-year floodplain is a severe economic and political liability:
- Mandatory Insurance Costs: Properties pulled into the Special Flood Hazard Area (SFHA) trigger mandatory flood insurance purchase requirements for homeowners with federally backed mortgages, adding hundreds to thousands of dollars in annual carrying costs.
- Construction Regulations: New development inside the SFHA must meet strict building standards under Title 44 of the Code of Federal Regulations (44 CFR Part 60), including elevating the lowest finished floor to or above the Base Flood Elevation.
- Property Valuation and Tax Base: Inclusion in an SFHA immediately suppresses unimproved land values, stalls planned commercial subdivisions, and shrinks the municipal property tax base.
Consequently, wealthy municipalities and real estate developers routinely hire private engineering firms to formally contest FEMA’s preliminary studies during the 90-day window. Armed with alternative hydraulic models, these consulting engineers adjust cross-section orientations, modify bridge geometry parameters, or argue for different regional skew coefficients to recalculate BFEs downward.
Cash-strapped counties and under-resourced rural towns lack the hundreds of thousands of dollars required to hire private modeling firms, creating an unequal regulatory landscape: affluent suburbs successfully litigate their way out of flood zones, while poorer, rural communities remain stuck with whatever approximate studies FEMA generates.
The LOMR and LOMR-F Loopholes
Even after a map is finalized and made legally effective, developers have access to administrative mechanisms known as Letters of Map Change (LOMC), specifically Letters of Map Revision (LOMR) and Letters of Map Revision Based on Fill (LOMR-F).
                          THE LOMR-F "FILL" DISPLACEMENT TRAP

       Original Floodplain Level
  ~~~~~~~~~~~~~~~~~~~~~~~~~~~~~~~~~~~~~~~~~~~~~~~~~~~~~~~~~~~~~~~~~~~~~~~~~~~~~~~~~ [Flood Water]
                      |
                      v
      +---------------------------------+
      | Imported Earthen Fill           |  <-- Developer dumps dirt; elevates foundation 6 inches
      | (Raises home above BFE)         |      above Base Flood Elevation. FEMA approves LOMR-F.
      +---------------------------------+      Insurance requirement REMOVED.
      | Original Parcel (Was in SFHA)   |
  =================================================================================
                                |
                                v
      [Water Displacement: The Bathtub Effect]
      Water that once naturally spread over the fill site is displaced, raising flood stages
      and accelerating velocities onto adjacent, un-elevated neighboring properties.
Under the LOMR-F process, a developer can purchase low-lying land within a regulated 100-year floodplain, dump thousands of cubic yards of earthen fill onto the parcel to elevate the building pad inches above the Base Flood Elevation, and submit an application to FEMA under 44 CFR Part 65. FEMA routinely issues a formal letter stripping the property of its high-risk designation, which removes the federal flood insurance mandate and allows slab-on-grade construction.
This practice generates cumulative hydraulic harm:
- The Bathtub Effect: Placing solid fill in a natural floodplain removes hydraulic storage capacity. When the river rises, the water that would have spread across that acreage is displaced, elevating flood levels on adjacent properties that were previously safe.
- Structural Vulnerability: The earthen fill is susceptible to saturated soil failure, scouring, and slope destabilization during high-velocity riverine events. When a 500-year or non-stationary storm exceeds the design elevation, the home sits on an artificial island completely surrounded by deep, high-velocity water, isolated from emergency services.
The Levee Accreditation Mirage (44 CFR 65.10)
A profound regulatory compromise occurs in levee-protected basins. Under FEMA standard 44 CFR 65.10, if an earthen levee or floodwall is certified by a registered professional engineer to provide protection against the 1 percent annual chance flood, and maintains a minimum of three feet of additional height (known as "freeboard"), FEMA maps the entire basin behind the levee as Zone X (unshaded).
                        THE 44 CFR 65.10 "ZONE X" LEVEE ILLUSION

                                             +-------------------------------------+
                                             | Certified Levee                     |
                                             | Designed for 100-Year Event + 3ft   |
                                             +-------------------------------------+
                                                    |
                                                    v
  RIVER STAGE                                  Levee Crest
  ~~~~~~~~~~~~~~~~~~~~~~~~~~~~~~~~~             |==|
  100-Year Base Flood Elevation (BFE)           |  |
  ~~~~~~~~~~~~~~~~~~~~~~~~~~~~~~~~~             |  |      PROTECTED BASIN (MAPPED AS ZONE X)
                                                |  |      - Mandatory Insurance: WAIVED
                                                |  |      - High-Density Housing Built
                                                |  |      - Zero Floodplain Building Codes
  ==============================================|  |========================================
                                                |  |
                                                \  /  <-- Catastrophic Residual Risk:
                                                 \/       If river hits a 150-year stage or levee
                                                          suffers geotechnical piping, the entire
                                                          basin fills like a bathtub.
By mapping the protected area as low-risk Zone X, the federal government removes all mandatory flood insurance requirements and allows developers to construct high-density subdivisions, hospitals, and schools in historic river channels.
This regulatory fiction ignores residual risk. Levees are designed to a specific hydraulic capacity; they do not eliminate flood risk, they merely redistribute it. If an extreme precipitation event generates streamflows that exceed the 100-year design capacity—or if structural piping, erosion, or gate failures cause a breach—the levee holds the water in, transforming the protected neighborhood into a deep reservoir. Because residents were told by their FIRMs that they lived in a safe Zone X, almost none hold active insurance policies when the levee fails.
The Bifurcated Architecture: Risk Rating 2.0 vs. The Regulatory Map Lock-In
In October 2021, FEMA initiated a historic overhaul of its insurance rating engine, dubbed Risk Rating 2.0: Equity in Action. For the first time in the fifty-year history of the National Flood Insurance Program, FEMA abandoned static flood zones as the primary mechanism for setting insurance premiums.
                        THE SPLIT REALITY OF FEDERAL FLOOD POLICY

                                FEDERAL FLOOD POLICY
                                         |
            +----------------------------+----------------------------+
            |                                                         |
            v                                                         v
    INSURANCE PRICING                                        LAND USE & MANDATES
  [Risk Rating 2.0 Engine]                                 [Regulatory FIRM Maps]
  - Catastrophe Model Logic                                - Static 1D/2D Boundaries
  - Continuous Property-Level Risk                         - Binary: In (SFHA) or Out (Zone X)
  - Distance to River, Coast, Runoff                       - Governs Local Building Codes
  - Foundation Type & Structural Value                     - Dictates Mortgage Insurance Mandate
            |                                                         |
            v                                                         v
  "Actuarial Reality"                                      "Regulatory Illusion"
  Rates reflect actual vulnerability;                      Homeowners told they are in Zone X;
  Premiums spike for risky homes.                          Drop insurance because it's not mandated.
Under Risk Rating 2.0, NFIP actuaries use private-sector catastrophe models, high-resolution geospatial data, and dynamic computing to price policies based on individual property characteristics:
- Distance to the flooding source (river, coast, or stormwater bottleneck).
- Ground elevation of the structure relative to surrounding topography.
- Structural foundation type (slab, crawlspace, basement, elevated pilings).
- Replacement cost value of the structure.
- Multi-frequency flood hazard data, including inland pluvial rainfall scenarios.
Risk Rating 2.0 represents a massive analytical leap forward for insurance pricing, but it created a dangerous regulatory contradiction.
While FEMA modernized how it prices insurance policies, the agency did not—and legally cannot, without Congressional reform—change the regulatory mechanism that mandates insurance and dictates local land-use zoning. The statutory framework established by Congress in the Flood Disaster Protection Act of 1973 ties the mandatory flood insurance purchase requirement exclusively to properties located inside the Special Flood Hazard Areas delineated on traditional Flood Insurance Rate Maps.
                      THE RESULTING PROTECTION GAP INLAND

  Total U.S. Properties with Real 1% Flood Exposure (First Street / KatRisk Data):
  [========================================================] ~17.7 Million Properties

  Properties Formally Identified in FEMA High-Risk SFHAs:
  [=========================] ~7.9 Million Properties

  The Unmapped / Unregulated Exposure Gap:
  [.........................][=============================] ~9.8 Million Properties
                             ^
                             Over 9.8 million properties face acute flood danger
                             without mandatory insurance or floodplain building standards.
This structural disconnect paralyzes public risk awareness. Under Risk Rating 2.0, an unmapped home sitting on a low-lying bench twenty feet from an un-gauged mountain tributary may be priced by FEMA’s backend algorithm as a high-risk structure. However, because the public-facing FIRM still shows the home in low-risk Zone X, the mortgage lender is forbidden by federal statute from requiring a policy.
The homeowner looks at their mortgage paperwork, sees that flood insurance is not required, and opts not to purchase optional coverage. Across the entire United States, fewer than 4 percent of homeowners hold flood insurance. In inland counties, that figure routinely hovers between 0.5 percent and 2 percent.
When flawed hydrologic modeling and inaccurate flood maps miscalculate river hazards, they do not just alter an engineering drawing—they strip communities of the basic financial liquidity required to recover after a disaster. Uninsured homeowners are left to rely on FEMA Individual Assistance (IA) grants, which are capped by statute and typically deliver only $3,000 to $8,000 in emergency aid—a tiny fraction of the $150,000 or more required to remediate a flooded home.
Case Studies: Forensic Breakdown of River Disasters
To see how these modeling shortcuts, mathematical assumptions, and bureaucratic exemptions converge in the real world, consider three major inland flood disasters of recent years.
                     GEOGRAPHIC ANATOMY OF THREE MODELING FAILURES

  1. Asheville & Buncombe County, NC (Hurricane Helene, 2024)
     - Flaw: 1D backwater modeling + complete omission of mountain headwater gullies.
     - Result: 98% of flooded properties lacked insurance; <2% were mapped in SFHA.

  2. Eastern Kentucky Hollows (Summer 2022 Flash Deluges)
     - Flaw: 1-sq-mile drainage threshold blinded maps to narrow creek channels.
     - Result: 39 deaths; >80% of inundated structures sat in unmapped Zone X.

  3. Montpelier & Barre, VT (Winooski River Basin, 2023 & 2024)
     - Flaw: Stationary historical baseline (Atlas 14) + unmapped riverbed sediment shifting.
     - Result: Downtown business districts inundated twice in 12 months under outmoded BFEs.
1. The Blue Ridge Deluge: Western North Carolina (2024)
When the remnants of Hurricane Helene met a stationary antecedent cold front over the Southern Appalachians, it dropped over 30 inches of precipitation across slopes that were already saturated to 100 percent field capacity.
Forensic engineering analyses revealed that the catastrophic destruction along the Swannanoa, Broad, and French Broad river basins occurred across three distinct zones of failure:
- The Valley Floor Blowout: In the Biltmore Village district of Asheville, the effective FEMA FIRM was constructed using legacy 1D steady-state HEC-2 and HEC-RAS models. The models failed to account for the dynamic constriction caused by highway bridge embankments acting as temporary debris dams. When water backed up behind the bridges, it reached stages far higher than the Base Flood Elevations mapped on the federal rate maps, submerging commercial structures that were elevated to the old regulatory standard.
- The Unmapped Hollows: In small communities like Swannanoa, Black Mountain, and Fairview, violent flash floods roared down headwater channels that had never been studied by FEMA because their catchment areas fell beneath the 1-square-mile cutoff. High-velocity debris flows containing trees, mud, and boulders tore through subdivisions that were marked as Zone X.
- The Insurance Void: Because only 2 percent of properties across the region were in mapped SFHAs, fewer than 1 in 100 families had federal flood insurance policies, resulting in billions of dollars of uninsured private property loss.
                              THE BILTMORE VILLAGE HYDRAULIC TRAP

       Upstream Inundation Level (Actual Helene Stage)
  ~~~~~~~~~~~~~~~~~~~~~~~~~~~~~~~~~~~~~~~~~~~~~~~~~~~~~~~~~~~~~~~~~~~~~~~~~~~~~~~~~
                                           \
                                            \    Highway Bridge Embankment
                                             \   (Acts as unintended debris dam)
                                              \    |=====|
  Mapped 100-Year BFE Elevation               |    |     |
  ~~~~~~~~~~~~~~~~~~~~~~~~~~~~~~~~~~~~~~~~~~~~|~~~~|     |~~~~~~~~~~~~~~~~~~~~~~~~~
                                              |    |     |   Downstream Channel
                                              |    |=====|   (1D model assumed
                                              |              unrestricted flow)
  ============================================+====================================
2. The Narrow Hollows of Eastern Kentucky (2022)
In July 2022, an atmospheric river stalled over eastern Kentucky, dumping up to 16 inches of rain in less than 12 hours across the Appalachian Plateau. The disaster killed 39 people and flattened entire hamlets along the North Fork of the Kentucky River, Troublesome Creek, and their tributaries.
A technical post-mortem by geospatial researchers showed that the primary killer was the statutory exclusion of pluvial and small-stream mapping:
- More than 80 percent of the destroyed housing stock sat completely outside FEMA’s Special Flood Hazard Areas.
- The homes were located along first- and second-order mountain branches where the steep valley walls concentrate runoff into high-velocity torrents in minutes.
- Because the local municipalities had adopted minimum federal floodplain standards based on approximate Zone A maps that lacked surveyed Base Flood Elevations, no elevation certificates were required, and residences were built at grade directly in the path of the mountain washes.
3. The Winooski and Lamoille River Basins: Vermont (2023 and 2024)
In July 2023, and again in July 2024, the state capital of Montpelier and neighboring Barre were inundated by the Winooski and Stevens Branch rivers.
These floods highlighted the vulnerability of New England’s historic river valley downtowns:
- The hydraulic models underlying Vermont’s flood maps relied on NOAA Atlas 14 rainfall distributions that significantly under-represented the frequency of multiday convective events in the Northeast.
- The river channels had undergone major morphological changes—accumulating gravel bars, sediment deposition, and bank erosion from Tropical Storm Irene in 2011—that were never updated in the hydraulic cross-sections of the state’s effective FIRMs.
- The models treated the river bed as a rigid, unmovable boundary, completely ignoring fluvial geomorphic erosion hazards—the physical scouring away of valley floor land that causes catastrophic structural collapses even when water elevations remain below calculated BFEs.
The Private Modeling Revolution and the Data Divide
As public flood maps continue to struggle with regulatory inertia, an entirely separate ecosystem of high-resolution hydrodynamic modeling has emerged in the private sector and academic institutions.
Organizations like the First Street Foundation, KatRisk, Fathom, and academic research groups have built computational architectures that bypass the statutory and technical restrictions imposed on FEMA.
                FEMA REGULATORY MAPS VS. CONTINENTAL-SCALE PRIVATE MODELS

  Feature / Capability            FEMA FIRMs (Public Standard)     Private / Academic Models
  ---------------------------------------------------------------------------------------------
  Coverage                        ~60% of CONUS Stream Miles       100% of CONUS Land Area
  Rainfall Data                   Static Historical (Atlas 14)     Dynamic / Climate-Adjusted
  Pluvial (Rain-on-Grid)          NO (Excluded by practice)        YES (Calculated per cell)
  Headwaters (< 1 sq mi)          NO (Statutory cutoff)            YES (Continuous hydrography)
  Update Cadence                  Decadal (Avg 7-10+ years)        Annual / Bi-annual
  Legal Status                    MANDATORY (Dictates Law)         INFORMATIONAL (Ignored by law)
The differences in methodology yield starkly contrasting pictures of national exposure:
- Coverage: FEMA has mapped detailed flood hazards for roughly one-third of the nation’s 3.5 million miles of rivers and streams. The rest are either covered by un-computed approximate sketches (Zone A) or left completely blank. Modern continental-scale models apply continuous 2D hydrodynamic solvers across every square meter of the lower 48 states.
- Identified Vulnerability: While official FEMA flood maps indicate that roughly 7.9 to 8.7 million properties reside within the high-risk 100-year floodplain, comprehensive 2D models show that more than 17.7 million properties face an equivalent 1 percent annual chance flood risk.
This data divide has spawned a two-tiered system of risk intelligence. Institutional mortgage investors, global reinsurance syndicates, and Wall Street rating agencies purchase commercial catastrophe data to protect their balance sheets and divest from vulnerable real estate portfolios.
Meanwhile, everyday homebuyers, local zoning boards, and municipal planning commissions remain legally tethered to inaccurate flood maps downloaded from the FEMA Flood Map Service Center. A homeowner can purchase a home outside the official SFHA, be told by their lender that they do not need insurance, and have no institutional mechanism warning them that private catastrophe algorithms rate their property as an extreme flood hazard.
Technical and Policy Reform: What Next-Generation Mapping Must Deliver
Transforming the nation’s flood hazard infrastructure requires dismantling the artificial technical and statutory boundaries that have separated engineering reality from regulatory maps for more than half a century.
                     THE ROADMAP TO ACCURATE FLOOD MAPPING

  [ Atmospheric Input ]     --> Transition fully to NOAA Atlas 15 (Vols 1 & 2)
                                Integrate non-stationary, climate-informed rainfall baselines.

  [ Computational Engine ]  --> Universal 2D Shallow Water Hydrodynamics
                                Mandate Rain-on-Grid modeling; eliminate 1D steady-state HEC-2 models.

  [ Physical Scope ]        --> Eliminate the 1-Square-Mile Drainage Cutoff
                                Map headwaters, hollows, and urban pluvial stormwater networks.

  [ Statutory Alignment ]   --> Decouple Insurance Mandates from Binary Lines
                                Enact national mandatory real estate flood disclosures;
                                Base mortgage mandates on continuous, probabilistic depth-damage risk.
1. The Rollout of NOAA Atlas 15
The cornerstone of technical modernization is the nationwide completion and implementation of NOAA Atlas 15. Authorized and funded under the Bipartisan Infrastructure Law, Atlas 15 moves the federal precipitation baseline from a stationary, region-by-region historical record to a spatially continuous, nationally consistent dataset:
- Volume 1 updates historical observations through the present day, using non-stationary statistical equations that account for observed temporal trends.
- Volume 2 delivers model-projected adjustment factors extending precipitation frequency estimates through 2100 under varied carbon emissions scenarios.
With final published estimates for the contiguous United States scheduled to replace Atlas 14 as the authoritative federal standard, hydraulic engineers will finally have a legally defensible foundation to model future rainfall intensities. However, the critical operational challenge is ensuring FEMA and local communities immediately integrate Atlas 15 into active flood insurance studies, rather than allowing legacy Atlas 14 baselines to persist in pending regulatory reviews.
2. Universal 2D Rain-on-Grid Simulations
The U.S. Army Corps of Engineers and FEMA must fully retire 1D steady-state modeling for regulatory studies. Federal flood hazard mapping should require 2D unsteady shallow water equations utilizing GPU-accelerated computing meshes.
By running Rain-on-Grid (direct precipitation) simulations, 2D engines apply precipitation hyetographs directly to every cell in the digital elevation model. This technique automatically solves both pluvial pooling on upland terraces and fluvial flooding along stream corridors in a single hydrodynamic framework, eliminating the unmapped 1-square-mile headwater loophole that proved so deadly across the Appalachians.
3. Federal Legislative Modernization of the NFIP
Engineering advancements will remain largely ineffective if the underlying legal framework governing the National Flood Insurance Program is not overhauled. The Technical Mapping Advisory Council (TMAC)—a federal advisory committee established to guide FEMA—has repeatedly outlined structural recommendations that require Congressional action:
- Eliminate Binary Flood Zones: The law must abolish the simplistic inside/outside line that convinces property owners in Zone X that they are immune from flood disasters. Risk should be communicated as a continuous, probabilistic spectrum of water depths over 30-year mortgage horizons.
- Universal Real Estate Disclosure: Federal law should mandate that home sellers and landlords disclose a property's complete flood history, insurance claims, and continuous risk profile prior to any transaction, ending the practice of passing unmapped flood risks to uninformed buyers.
- Close the Fill and Levee Loopholes: FEMA must overhaul 44 CFR Part 65 to account for the cumulative displacement impacts of earthen fill (LOMR-F) and require residual risk insurance purchase mandates for properties located behind certified levees.
The Road Ahead: The Collision of Engineering Reality and Economic Inertia
The United States stands at the threshold of an unavoidable reckoning over flood hazard geography. As advanced 2D hydrodynamic models and NOAA Atlas 15 data bring the true scale of national river risk into focus, they will collide directly with the economic and political realities of the housing market.
Accurately remapping America’s river basins means formally acknowledging that millions of homes, thousands of commercial districts, and hundreds of vital civic assets sit squarely in the path of life-threatening water.
Doing so will inevitably drive up insurance costs, suppress real estate valuations in historic flood corridors, and require billions of dollars in infrastructure retrofits. Municipalities will face intense friction as they balance developer-driven tax base expansion against the moral duty to enforce safe building setbacks.
Yet the cost of sustaining the current illusion is exponentially higher. Every river disaster makes plain that floodwaters do not stop at arbitrary lines drawn across fifty-year-old paper maps.
Until the nation aligns its regulatory maps with the physical laws of fluid dynamics, the non-stationary reality of atmospheric mechanics, and the true topography of its watersheds, the federal government will continue to preside over an engineered tragedy: designing maps that miscalculate disaster, and leaving millions of Americans to discover the true elevation of the river only when it breaks through their front doors.
Reference:
- https://www.iii.org/blog/hurricane-helene-highlights-inlandflood-protection-gap
- https://www.richmondfed.org/research/national_economy/macro_minute/2024/hurricane_helene_flood_risk_and_insurance_20241015
- https://www.floodbase.com/case-studies/federal-flood-maps-are-no-match-for-floridas-double-hurricane
- https://neptuneflood.com/research/deep-dive-into-fema-flood-maps/
- https://www.gao.gov/products/gao-22-104079
- https://www.nrdc.org/bio/joel-scata/femas-outdated-and-backward-looking-flood-maps
- https://www.floods.org/news-views/research-and-reports/firm-2d-a-new-methodology-for-using-hec-ras-2d-models-in-flood-insurance-maps/
- https://damtoolbox.org/wiki/Guidelines_for_Determining_Flood_Flow_Frequency_(Bulletin_17C))
- https://firststreet.org/research-library/understanding-fema-flood-maps-and-limitations
- https://climatecheck.com/risks/flood/can-you-change-your-fema-flood-zone
- https://pubs.usgs.gov/publication/tm4B5
- https://neptuneflood.com/research/deep-dive-into-fema-flood-maps/
- https://www.midatlanticrisa.org/climate-primers/atlas-15.html
- https://studio.m-anage.com/agu/agu24/meetingapp.cgi/Paper/1635141
- https://water.noaa.gov/about/atlas15
- https://un-spider.org/advisory-support/recommended-practices/recommended-practice-flood-hazard-assessment/step-by-step
- https://www.kin.com/blog/fema-flood-maps/
- https://evstudio.com/flood-map-designations-and-map-revisions-explained/
- https://www.claimsjournal.com/news/national/2022/11/03/313603.htm
- https://www.fema.gov/flood-maps/change-your-flood-zone/lomr-clomr
- https://www.withforerunner.com/post/navigating-flood-map-changes-lomas-lomrs-and-more
- https://www.nfp.com/insights/rethinking-flood-risk/