
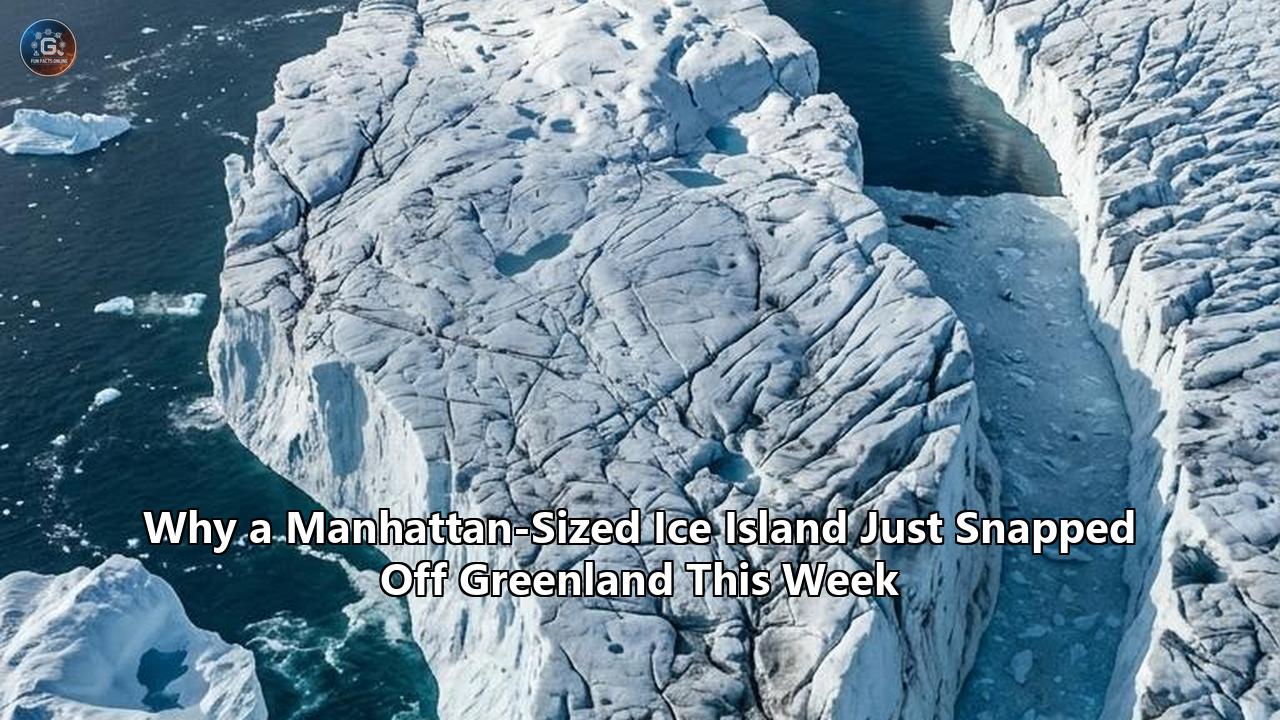
On August 4, 2026, a massive slab of glacial ice measuring 76.4 square kilometers (29.5 square miles) sheared off the floating terminus of northwest Greenland’s Petermann Glacier, creating a free-floating ice island larger than Manhattan Island. Detected via synthetic aperture radar aboard the European Space Agency’s Copernicus Sentinel-1 constellation and monitored in real time by scientists aboard the polar research vessel RRS Sir David Attenborough, the detachment marks the single largest loss of floating ice from Petermann since 2012 and the Arctic’s most substantial calving event since 2020.
The newly birthed tabular iceberg, up to 150 meters (nearly 500 feet) thick, severed along a network of deep longitudinal fissures and transverse rift systems that glaciologists have tracked from orbit for over seven years. While tabular calving is a standard mechanism of mass discharge for marine-terminating glaciers, the structural failure of this eastern section represents more than a routine seasonal fracture. It provides a real-time window into the broader mechanics of Greenland ice shelf collapse, illustrating how atmospheric warming, sub-ice ocean currents, and dynamic tidal flexing converge to destabilize Earth's northern cryosphere.
Petermann Glacier acts as a primary drainage gateway for the northwest sector of the Greenland Ice Sheet, channeling approximately 4% of the entire ice sheet's mass into the Arctic Ocean. The grounded ice upstream from Petermann contains enough frozen freshwater to raise global mean sea levels by 38 centimeters (15 inches) if discharged entirely.
The August 2026 calving event demonstrates that the processes dismantling polar ice shelves operate through non-linear thresholds rather than steady, uniform decay. By analyzing the anatomy of this fracture, researchers can extract critical lessons regarding ocean-ice thermodynamic coupling, grounding-line instability, and the weakening of buttressing forces across Greenland’s remaining floating glacier tongues.
                     PETERMANN GLACIER STRUCTURAL GEOMETRY
                                                                Nares Strait
 Inland Ice Sheet         Grounding Zone           Floating Tongue   (Ocean)
═════════════════════════════════════════════════════════════════════╗
  GROUNDED ICE (Thick)     Tidal Cavity         THINNING ICE TONGUE   ║
------------------------\ (Seawater Pump)      /-------------------- ║ [Calving
  Bedrock (Retrograde)   \                    /                      ║  Front]
                          \                  /   Basal Channels      ║   |
                           \================/    (Upward Melting)    ║   v
                              ▲                            ▲         ║ [76.4 km²
                              │ Warm Atlantic Water (AIW)  │         ║  Ice Island]
                              └────────────────────────────┘         ╚═════════════
1. The Anatomy of the August Rupture
The physical separation of the 76.4-square-kilometer tabular slab occurred with exceptional speed once critical stress thresholds were breached. Synthetic aperture radar imagery acquired by the Sentinel-1 satellite system showed rapid crack propagation along the central flowline of the floating ice tongue beginning on August 3. By 20:00 UTC on August 4, structural cohesion along the eastern margin failed completely, allowing the tabular mass to pivot into the waters of Petermann Fjord.
Glaciologists tracking the glacier had anticipated the event. Adam Garbo, a doctoral researcher at the University of Ottawa who identified the initial separation, confirmed that the rift system responsible for the break had been widening progressively since 2019.
"Petermann Glacier has long been one of Greenland’s largest remaining ice tongues," Garbo stated following the detection. "We’ve anticipated this break for years, and seeing it finally happen is remarkable. It’s a powerful reminder of how quickly these systems can change."
The detachment followed a distinct trajectory governed by the structural geometry of the floating tongue. The ice shelf occupies a steep-walled fjord roughly 15 to 20 kilometers wide and over 70 kilometers long. As ice flows seaward from the grounding line—where the glacier loses contact with the bedrock and begins to float—it encounters lateral shear stress along the fjord walls. Over the past decade, continuous basal melting thinned the floating ice from below, reducing its structural stiffness and creating longitudinal channels that aligned directly with the glacier's flow direction.
                CHRONOLOGY OF THE AUGUST 2026 CALVING EVENT
┌──────────────┐     ┌──────────────┐     ┌──────────────┐     ┌──────────────┐
│  2019–2025   │     │  April 2026  │     │ August 3, '26│     │ August 4, '26│
│ Transverse   │ ──> │ Interferom-  │ ──> │ Sentinel-1   │ ──> │ 76.4 km²     │
│ rifts deepen │     │ etry shows   │     │ radar shows  │     │ ice island   │
│ & propagate  │     │ accelerating │     │ rapid center-│     │ completely   │
│ across shelf │     │ deformation  │     │ line shear   │     │ detaches     │
└──────────────┘     └──────────────┘     └──────────────┘     └──────────────┘
The August 2026 calving event represents Petermann's third major structural collapse of the 21st century. In August 2010, the glacier shed a massive 251-square-kilometer ice island—the largest single calving event recorded in the Arctic in nearly fifty years. In July 2012, a second fracture released an additional 130-square-kilometer slab.
Following the 2012 event, the glacier entered a 14-year period of relative terminus stability, during which the ice slowly advanced down-fjord. However, while the glacier's front advanced, its internal structure was progressively deteriorating.
+-----------------------------------------------------------------------------+
|               MAJOR CALVING EVENTS AT PETERMANN GLACIER (2010–2026)         |
+---------------+---------------------+------------------+--------------------+
| Year          | Calved Area (km²)   | Calved Area (mi²)| Primary Driver     |
+---------------+---------------------+------------------+--------------------+
| August 2010   | 251.0               | 96.9             | Transverse Rift    |
| July 2012     | 130.0               | 50.2             | Lateral Shear Rift |
| August 2026   |  76.4               | 29.5             | Basal Incision /   |
|               |                     |                  | Centerline Shear   |
| Projected #1  | ~94.0–97.0          | ~36.3–37.4       | Mid-Shelf Rift     |
| Projected #2  | ~84.0–87.0          | ~32.4–33.6       | Upstream Crevasse  |
+---------------+---------------------+------------------+--------------------+
The August 2026 event is not an isolated terminal fracture; rather, it is the first phase of a multi-stage structural disintegration. Satellite radar interferometry shows that two additional transverse fractures remain active upstream of the current calving front. These interior rifts isolate two subsequent slabs measuring approximately 94 to 97 square kilometers and 84 to 87 square kilometers.
When these pending segments separate, the cumulative calving sequence will remove over 254 square kilometers of floating ice—stripping approximately 22% of Petermann’s total floating tongue and pushing the terminus farther inland than at any point in modern observational history.
2. Satellite Interferometry and Real-Time Fracture Tracking
The capture of the 2026 Petermann calving event highlights advances in cryospheric observation. Historically, polar calving events were documented retrospectively when cloud-free optical imagery became available weeks or months after an iceberg had already drifted into open water. The deployment of high-frequency Synthetic Aperture Radar (SAR) constellations has transformed these dynamics into observable structural mechanics.
SAR sensors emit microwave pulses that penetrate clouds, polar fog, and seasonal darkness, reflecting off the glacial surface to generate high-resolution imagery regardless of atmospheric conditions. During the weeks preceding the August 4 break, radar interferometry—a technique that measures phase differences between successive radar passes to detect millimeter-scale surface displacement—identified acute strain anomalies along Petermann’s floating tongue.
                      INTERFEROMETRIC PHASE FRINGE CONCEPT

  Pass 1 (t0) ─── Radar Pulse ───> [ Surface Profile A ]
                                           │  (Micro-displacement / Tidal Flexure)
  Pass 2 (t1) ─── Radar Pulse ───> [ Surface Profile B ]
                                           │
  Phase Difference Calculation  ──> Δφ = (4π/λ) * ΔR
                                           │
  Resulting Interferogram       ──> High-density fringe patterns reveal active
                                    shear zones, rift dilation, and unpinning.
Molly Hammond, a doctoral researcher at the University of Leeds who processed the Sentinel-1 radar datasets during the event, noted the critical role of high-frequency orbital revisit times.
"The changes we observed on Petermann Glacier were occurring very rapidly in the lead up to the iceberg calving event, so it was incredibly exciting to monitor the crack propagation with interferometry in near-real time," Hammond explained. "This has demonstrated the capacity of SAR monitoring to quantify ice shelf destabilization before complete physical detachment occurs."
The radar interferograms revealed three sequential mechanics that precipitated the final structural collapse:
- Differential Flow Velocity Across Longitudinal Shear Margins: The center of Petermann’s floating tongue moves seaward at rates exceeding 1,100 meters per year, while the lateral edges dragging against the rock walls of Petermann Fjord are slowed to less than 200 meters per year. This velocity differential generates immense lateral shear stresses, opening narrow tension cracks (crevasses) along the margins.
- Transverse Rift Propagation: Rather than remaining confined to the shear margins, fractures began cutting perpendicular to the ice flow direction. The interferometry data showed that the rift responsible for the August 2026 break was widening at accelerated rates during spring 2026, driven by tidal flexing.
- Decoupling from Lateral Resistance: As basal melting hollowed out the underside of the glacier, the ice tongue lost structural contact with the fjord walls. Once the lateral friction was eliminated, the tensile stresses within the ice exceeded the fracture toughness of the crystal matrix, causing the rift to snap through the remaining ice thickness in less than 24 hours.
3. Subglacial Hydrodynamics: The Atlantic Ocean Heat Engine
While atmospheric warming triggers surface melting and hydrofracture, the primary driver behind the thinning and eventual breakup of Petermann Glacier lies hidden hundreds of meters below sea level. Petermann is vulnerable to ocean-driven basal melt because of the unique hydrography of Nares Strait and the bathymetry of the sub-ice cavity.
The water column inside Petermann Fjord is sharply stratified into two distinct layers:
- Polar Surface Water (PSW): Occupying the upper 100 to 200 meters, this layer consists of cold, low-salinity water with temperatures hovering near the freezing point (-1.5°C to 0°C).
- Atlantic Intermediate Water (AIW): Originating in the North Atlantic, this warmer, denser, and more saline water mass enters the Arctic basin via the West Spitsbergen and Fram Strait currents, circulating into Nares Strait at depths below 300 meters. Inside Petermann Fjord, AIW temperatures range between +0.3°C and +1.5°C.
                     PETERMANN FJORD HYDROGRAPHIC STRATIFICATION
  Depth (m)
      0 ┌─────────────────────────────────────────────────────────┐
        │ Polar Surface Water (Cold, Low Salinity: -1.5°C to 0°C)  │
    150 ├─────────────────────────────────────────────────────────┤  <-- Outer Sill
        │ Halocline / Pycnocline (Transition Zone)                 │      (350–410m)
    300 ├─────────────────────────────────────────────────────────┤
        │ Atlantic Intermediate Water (AIW)                       │  <-- Inner Deep Fjord
        │ (Warm, Dense, Saline: +0.3°C to +1.5°C)                  │      (Up to 1,150m)
        │                                                         │
   1150 └─────────────────────────────────────────────────────────┘
The seafloor bathymetry of Petermann Fjord plays a decisive regulatory role. Detailed multibeam bathymetric soundings conducted by international icebreaker expeditions have mapped the sub-ice topography. The entrance of Petermann Fjord features an outer sill at a depth of 350 to 410 meters.
Crucially, this sill is deep enough to allow warm Atlantic Intermediate Water to flow unrestricted into the inner fjord cavity, where depths plunge to 1,150 meters along the eastern wall.
                BUOYANT PLUME CIRCULATION AND BASAL INCISION

                Floating Ice Tongue Base (Melting at 10–50 m/yr)
    ~~~~~~~~~~~~~~~~~~~~~~~\~~~~~~~~~~~~~~~~~~~~~~~~/~~~~~~~~~~~~~~~~~~~~~~~~~
                            \   Basal Channel      /
                             \   (Incision)       /  <--- Highly turbulent,
                              \                  /        buoyant plume
                               \       ▲        /         drives intense
                                \      │       /          localized melt
                                 \     │      /
                                  \    │     /
  Warm, Dense AIW (>0.5°C)  ───────>   │    /
  Inflow at Depth (>400m)              │   /
                                       │  /
                               Subglacial Discharge (Qsg)
                               Enters at Grounding Line
Once inside the cavity, this warm water drives rapid submarine melting. When freshwater from surface melt drains through moulins and reaches the glacier's grounding line, it discharges into the sub-ice ocean cavity as a subglacial plume.
Because freshwater is far less dense than the saline Atlantic water, it rises rapidly along the inclined underside of the ice shelf. This upward-surging plume entrains the surrounding warm Atlantic water, accelerating turbulent heat exchange at the ice-ocean interface.
Research led by glaciologists at UC Irvine and NASA’s Jet Propulsion Laboratory confirms that basal melt rates under Petermann Glacier have risen from an average of 3 meters per year in the 1990s to more than 10 to 15 meters per year over the last decade, with localized channels experiencing melt rates exceeding 50 meters per year.
This process carves inverted subglacial canyons into the base of the ice shelf. These incisions act as structural stress concentrators: as the ice thins from below along these channels, the surface above sags, creating depression features that focus surface meltwater and align tension fractures directly above the basal incisions. The August 4 break occurred along the path of these basal channels.
4. The Tidal Grounding Zone: Redefining the Ice-Ocean Boundary
For decades, glaciological numerical models treated the grounding line—the boundary where grounded glacier ice lifts off the bedrock to become a floating shelf—as a narrow, static line. The August 2026 rupture at Petermann builds on an evolving empirical reality: the grounding line is not a line, but a dynamic, multi-kilometer grounding zone governed by ocean tides.
                 TIDAL GROUNDING ZONE MECHANISM (RIGNOT ET AL.)

           HIGH TIDE: Seawater Intrusions Under Grounded Ice

    Grounded Ice Sheet                     Floating Ice Tongue
   ═══════════════════════\                  /════════════════════════════
                           \                /
                            \              /  <--- Ice flexes upward
   ~~~~~~~~~~~~~~~~~~~~~~~~~~\~~~~~~~~~~~~/~~~~~~~~~~~~~~~~~~~~~~~~~~~~~~~
   Warm AIW Seawater Inflow   \          /
   Pushed KILOMETERS Inland    \        /
   ═════════════════════════════\======/──────────────────────────────────
   Bedrock (Retrograde Slope)    Grounding Zone (2 to 6 km wide)


           LOW TIDE: Sub-Ice Cavity Flush and Heat Transfer

    Grounded Ice Sheet                     Floating Ice Tongue
   ═══════════════════════\                  /════════════════════════════
                           \                /
                            \              /  <--- Ice settles downward
   ──────────────────────────\~~~~~~~~~~~~/~~~~~~~~~~~~~~~~~~~~~~~~~~~~~~~
   Meltwater Flushes Out      \          /
   Leaving High-Melt Cavity    \        /
   ═════════════════════════════\======/──────────────────────────────────
   Bedrock Cavity Carved Out (Up to 200m tall)
Groundbreaking satellite radar interferometry conducted by Eric Rignot and Ratnakar Gadi demonstrated that as ocean tides rise and fall across Petermann Fjord, the glacier shifts vertically, allowing warm seawater to penetrate kilometers beneath what was previously classified as grounded ice.
Key observations of the tidal grounding zone dynamics include:
- Tidal Migration Extent: The grounding line shifts dynamically across a zone between 2 and 6 kilometers wide twice daily with the tidal cycle.
- Sub-Ice Cavity Excavation: Warm Atlantic Intermediate Water forced into this grounding zone under high pressure has melted out an expansive subglacial cavity reaching over 200 meters (660 feet) in height—a vertical void taller than the Washington Monument.
- Accelerated Upstream Melting: Melt rates inside the grounding zone cavity are up to 50% higher than anywhere else along the floating ice tongue.
- Upstream Unpinning: Between 2000 and 2020, tidal seawater intrusion drove roughly 140 meters of basal ice thinning within the grounding zone. Over the last 30 years, Petermann's grounding line has retreated up to 7 kilometers inland in its central sector, migrating along a retrograde (inward-sloping) bedrock bed located 500 meters below sea level.
This grounding zone dynamic explains why ice shelves lose structural stability long before a catastrophic calving event occurs. The high-pressure tidal pump introduces thermal energy directly beneath the root of the glacier, decoupling the ice from bedrock pinning points and accelerating seaward velocity by 15%.
By the time the outer tabular ice island calved in August 2026, the mechanical support system upstream had already been undermined by decades of sub-ice tidal ablation.
5. Ice Shelf Buttressing and Upstream Ice Dynamics
To understand the systemic significance of the 2026 Petermann calving event, one must examine the physics of ice shelf buttressing. Floating ice tongues and ice shelves already displace their own weight in seawater, meaning their detachment does not directly add substantial volume to the ocean. However, their indirect impact on global sea-level rise is profound.
                     ICE SHELF BUTTRESSING DYNAMICS

  (A) INTACT ICE SHELF (STABLE REGIME)

  Grounded Ice Sheet ───> [Flow] ───> | Grounding Line | ───> Floating Shelf
                                              │                      │
                                       Back-Stress (σ_xx)      Lateral Drag &
                                       Resists Oceanward       Pinning Points
                                       Discharge               Hold Ice Back


  (B) PARTIAL COLLAPSE / DETACHMENT (CURRENT POST-AUGUST 2026 REGIME)

  Grounded Ice Sheet ──>> [Accelerated Flow] >> | Grounding Line Retreated |
                                              │
                                       Loss of Buttressing
                                       Ice Stream Accelerates Upstream
                                       Longitudinal Stretching Increases
An intact ice shelf acts as a mechanical retaining wall. As the floating ice tongue pushes seaward through a narrow fjord, lateral friction along the rocky sidewalls and compressive stresses over submarine pinning points generate a compressive back-stress ($\sigma_{xx}$) that propagates upstream. This back-stress resists the gravitational driving stress of the grounded inland ice sheet, throttling the rate at which interior ice can drain into the ocean.
The mechanical balance can be expressed through the depth-integrated longitudinal stress balance equation for an outlet glacier:
$$\frac{\partial}{\partial x} \left( 2 \bar{\nu} H \frac{\partial u}{\partial x} \right) + \tau_{lat} - \tau_b = \rho_i g H \frac{\partial s}{\partial x}$$
Where:
- $H$ is ice thickness
- $u$ is ice flow velocity along the flowline ($x$)
- $\bar{\nu}$ is effective ice viscosity
- $\tau_{lat}$ represents lateral shear stress from the fjord walls
- $\tau_b$ is basal drag at the bedrock interface
- $\rho_i g H \frac{\partial s}{\partial x}$ is the gravitational driving stress dictated by the surface slope ($\frac{\partial s}{\partial x}$)
When an ice shelf calves and thins, the lateral shear resistance ($\tau_{lat}$) decreases toward zero across the lost area. The sudden removal of downstream back-stress creates a force imbalance at the grounding line.
To restore mechanical equilibrium, the grounded glacier must accelerate, increasing its strain rate ($\frac{\partial u}{\partial x}$) and thinning dynamically. This process, termed dynamic thinning, draws down inland ice reserves and accelerates mass loss across the entire drainage basin.
┌─────────────────────────────────────────────────────────────────────────────┐
│                   CASCADING DYNAMICS OF BUTTRESSING REMOVAL                 │
│                                                                             │
│   Calving / Basal Thinning  ───>  Loss of Lateral Drag (τ_lat ↓)            │
│                                            │                                │
│   Steeper Surface Slope (∂s/∂x ↑) <── Dynamic Thinning of Grounded Ice      │
│                │                                   │                        │
│   Inland Ice Evacuation Accelerates  <── Grounding Line Retreats Up-Bed     │
│                │                                   │                        │
│                └───────────> GLOBAL SEA-LEVEL RISE <────────────────────────┘
└─────────────────────────────────────────────────────────────────────────────┘
The progressive loss of Petermann’s floating tongue is dismantling this buttressing architecture. The 2010 and 2012 calving events increased Petermann’s flow velocity by approximately 10% to 15%.
With the August 2026 break severing another 76.4 square kilometers and additional transverse rifts threatening another 180 square kilometers, glaciologists project a further acceleration of the upstream ice stream.
Because the glacier rests on a retrograde slope that dips downward inland from the coast, uncontrolled retreat past current pinning points could trigger Marine Ice Sheet Instability (MISI), raising fears of an irreversible Greenland ice shelf collapse that could unlock massive inland ice reserves.
6. Arctic Glaciology: Petermann, 79°N, and Ryder
Greenland once supported dozens of floating ice tongues and expansive ice shelves along its northern and north-eastern margins. Decades of atmospheric and oceanic warming have eliminated nearly all of them. Today, only three major floating glacier tongues remain in the entire Arctic basin:
- Petermann Glacier (Northwest Greenland)
- Nioghalvfjerdsfjorden (79°N Glacier) (Northeast Greenland)
- Ryder Glacier (North Greenland)
Comparing these three systems provides essential insights into why certain ice shelves collapse while others temporarily survive.
                 GREENLAND'S THREE REMAINING FLOATING ICE TONGUES

                        North Greenland (Arctic Ocean)
                                     │
      ┌──────────────────────────────┼──────────────────────────────┐
      │                              │                              │
      ▼                              ▼                              ▼
  PETERMANN GLACIER            RYDER GLACIER                   79°N GLACIER
  (Northwest)                  (North)                         (Northeast)
  ─────────────────────────    ─────────────────────────       ─────────────────────────
  • Length: ~50–70 km          • Length: ~25 km                • Length: ~80 km
  • Outer Sill: ~350–410 m     • Outer Sill: ~200 m            • Sub-ice Cavity: ~900 m
  • AIW Access: Unrestricted   • AIW Access: Blocked by Sill   • AIW Access: Unrestricted
  • Status: Active Calving     • Status: Dynamically Stable    • Status: Basal Thinning,
    (2010, 2012, 2026)           (Pinning Point Intact)          Spalte Disintegration
+-----------------------------------------------------------------------------------------+
| COMPARATIVE VULNERABILITY OF REMAINING ARCTIC ICE TONGUES |
+---------------------+-------------------+--------------------+--------------------------+
| Glacier / Shelf | Fjord Sill Depth | AIW Inflow Status | Primary Destabilization |
| | | | Mechanism |
+---------------------+-------------------+--------------------+--------------------------+
| Petermann Glacier | 350–410 m (Deep) | Unrestricted | Basal Incision & |
| | | | Tidal Cavity Melting |
| Ryder Glacier | ~200 m (Shallow) | Thermally Blocked | Stable Terminus; Minor |
| | | | Surface Melt |
| 79°N (Nioghalv- | Variable / Deep | High Thermal | Supraglacial Lake Drain- |
| fjerdsfjorden) | Channels | Inflow | age & Basal Melting |
+---------------------+-------------------+--------------------+--------------------------+Ryder Glacier: The Protective Sill
Located east of Petermann, Ryder Glacier terminates in Sherard Osborn Fjord. Despite experiencing similar atmospheric warming, Ryder Glacier has exhibited remarkable geometric stability over recent decades, with minimal grounding-line retreat or catastrophic calving.
Marine geological mapping aboard the icebreaker Oden resolved this paradox: Sherard Osborn Fjord possesses a shallow bathymetric sill rising to within 200 meters of the sea surface. This geological barrier physically blocks warm Atlantic Intermediate Water from entering the inner fjord cavity, shielding Ryder's ice base from the extreme basal melt rates that plague Petermann.
Nioghalvfjerdsfjorden (79°N Glacier): The Northeast Behemoth
The 79°N Glacier is Greenland’s largest remaining ice shelf, extending across an 80-kilometer-long fjord and draining the vast Northeast Greenland Ice Stream (NEGIS). In 2020, its northern offshoot, the Spalte Glacier, disintegrated into an armada of tabular icebergs covering 113 square kilometers.
Unlike Petermann, which is primarily driven by basal melting, 79°N is attacked simultaneously by two forces:
- Deep ocean channels funnel +1°C Atlantic water into a 900-meter-deep sub-ice cavern, driving basal thinning exceeding 130 meters since 1998.
- Atmospheric warming has created large supraglacial lakes on the shelf surface; these lakes drain catastrophically through crevasses, hydrofracturing the ice from the top down.
Examining these three systems highlights why vulnerability to Greenland ice shelf collapse varies dramatically depending on seafloor topography, ocean current pathways, and local atmospheric melt intensity.
7. Principles of Cryospheric Destabilization: Case Study Lessons
The August 2026 rupture of Petermann Glacier provides a framework for understanding the mechanics of ice sheet retreat. The event demonstrates that ice shelf deterioration is governed by coupled structural and thermodynamic principles rather than linear attrition.
┌─────────────────────────────────────────────────────────────────────────────┐
│                 FOUR PRINCIPLES OF ICE SHELF DESTABILIZATION                │
├─────────────────────────────────────────────────────────────────────────────┤
│  1. Topographic Gatekeeping Controls Basal Heat Flux                         │
│     Seafloor sills dictate whether warm intermediate ocean waters can       │
│     enter sub-ice cavities to drive rapid basal thinning.                   │
├─────────────────────────────────────────────────────────────────────────────┤
│  2. Dynamic Tidal Pumping Multiplies Grounding Zone Melt                    │
│     Vertical tidal deflection flexes the ice boundary, forcing warm seawater│
│     kilometers inland beneath grounded ice and carving large cavities.      │
├─────────────────────────────────────────────────────────────────────────────┤
│  3. Inverted Basal Channeling Preconditions Structural Fracture              │
│     Subglacial plumes carve longitudinal basal incisions that act as        │
│     stress risers, focusing surface crevassing and guiding rift propagation.│
├─────────────────────────────────────────────────────────────────────────────┤
│  4. Buttressing Loss Accelerates Non-Linear Upstream Evacuation             │
│     Removing lateral friction and terminal back-stress unbalances forces at │
│     the grounding line, triggering rapid dynamic thinning inland.           │
└─────────────────────────────────────────────────────────────────────────────┘
Principle 1: Topographic Gatekeeping Controls Basal Heat Flux
The vulnerability of a marine-terminating glacier to oceanic forcing is determined by seafloor bathymetry. Where bathymetric sills are deeper than the ocean pycnocline (roughly 250 to 300 meters), warm Atlantic Intermediate Water flows into the sub-ice cavity.
Without shallow protective sills, the thermal driving potential ($\Delta T = T_{ocean} - T_{freeze}$) remains strongly positive year-round, sustaining basal melting independent of surface weather.
Principle 2: Dynamic Tidal Pumping Multiplies Grounding Zone Melt
Grounding lines are active tidal pumping zones rather than static hinges. As high tides lift the ice shelf, hydrostatic pressure forces warm seawater kilometers inland along subglacial channels, exposing grounded ice to basal ablation.
Because numerical ice sheet models frequently assume zero ocean melting inland of the static grounding line, current projections systematically underestimate the rate of grounding line retreat and ice sheet mass loss.
                     STRESS CONCENTRATION IN BASAL CHANNELS

       Tension Cracks Form Above Depression
              │       │       │
              ▼       ▼       ▼
       ──────┐                 ┌──────  <--- Ice Shelf Surface (Sagging)
             │                 │
             │   ICE MATRIX    │
             │                 │
       ──────┘                 └──────
                   ▲     ▲
                   │     │
            [ Inverted Basal Channel ]  <--- Upward Buoyant Plume Melting
                                             Reduces Local Thickness by >50%
Principle 3: Inverted Basal Channeling Preconditions Structural Fracture
Submarine melt is not distributed uniformly across the base of an ice shelf. Instead, it concentrates along subglacial discharge plumes, carving deep, linear channels into the ice shelf's underside.
These basal channels reduce local ice thickness by more than 50%, altering the transverse stress field and creating longitudinal surface depressions. Tensile stresses concentrate along the thin roofs of these channels, establishing preferred fracture paths that guide rift propagation months or years before calving occurs.
Principle 4: Buttressing Loss Accelerates Non-Linear Upstream Evacuation
Ice shelves act as mechanical regulators for the interior ice sheet. The removal of floating ice reduces lateral drag and terminal back-stress, inducing immediate strain-rate acceleration across the grounding line.
The structural lessons of this event underscore that Greenland ice shelf collapse is not a gradual ablation process; it is a step-function shift where the removal of structural resistance unlocks rapid, widespread dynamic mass loss upstream.
8. Oceanographic Trajectory, Maritime Hazards, and Monitoring
The birth of the August 2026 ice island introduces environmental and maritime challenges that will unfold across the high Arctic and North Atlantic over the next several years. Tabular ice islands of this magnitude behave differently from typical angular icebergs produced by tidewater glaciers.
Because of their immense surface area and draft of over 100 meters, they are steered primarily by deep ocean currents rather than surface winds, posing distinct navigational hazards and altering local marine ecosystems.
                  DRIFT TRAJECTORY OF THE NEW ARCTIC ICE ISLAND

    [ Petermann Fjord ] ───> Detached August 4, 2026
            │
            ▼
    [ Hall Basin / Nares Strait ] ───> Southward transport via Kennedy Channel
            │
            ▼
    [ Baffin Bay ] ───> Multi-year fragmentation & melt
            │
            ▼
    [ Davis Strait / Labrador Sea ] ───> Enters North Atlantic Shipping Corridors
Anna Crawford, an ice island specialist at the University of Stirling participating in the monitoring consortium, emphasized the broader scientific value of tracking this drifting ice mass.
"While large, tabular icebergs are relatively common in the Southern Ocean around Antarctica, Arctic ice islands are far rarer," Crawford noted. "By studying Arctic ice islands, we will gain knowledge that can be transferred across polar regions. This is critical for understanding how the calving and deterioration of ice islands impact glacier dynamics, sea-level rise and the ocean environment."
+-----------------------------------------------------------------------------+
|              OBSERVATIONAL METRICS OF THE 2026 CALVING EVENT                |
+------------------------------------+----------------------------------------+
| Parameter                          | Value / Metric                         |
+------------------------------------+----------------------------------------+
| Calved Area                        | 76.4 km² (29.5 sq miles)               |
| Maximum Ice Thickness              | ~150 meters (492 feet)                 |
| Estimated Calved Mass              | ~8.5 to 10.5 Gigatons (Gt)             |
| Initial Drift Direction            | Southwest into Hall Basin/Nares Strait |
| Monitoring Systems                 | Copernicus Sentinel-1 SAR, Sentinel-2, |
|                                    | ICESat-2, RRS Sir David Attenborough   |
| Tracking Agency                    | Environment and Climate Change Canada, |
|                                    | Canadian Ice Service, US National Ice  |
|                                    | Center                                 |
+------------------------------------+----------------------------------------+
Maritime Navigation Risks
As the ice island drifts southward through the narrow, shallow channels of Nares Strait—such as Kennedy Channel and Smith Sound—it encounters extreme bathymetric shoals. Tabular bergs frequently run aground on shallow coastal banks, scouring the seafloor benthic ecosystems and creating navigation choke points.
When the island eventually breaks apart under wave action and thermal erosion in Baffin Bay, it will fragment into thousands of smaller icebergs, "bergy bits," and semi-submerged "growlers". These hard, low-profile ice fragments are difficult for shipboard radar to detect, posing severe collision risks to commercial cargo traffic traversing the Northwest Passage and supply vessels supporting Arctic communities.
Environment and Climate Change Canada (ECCC) and the International Ice Patrol have deployed satellite-tracked beacon arrays directly onto the ice surface to monitor its drift trajectory in real time.
                     FRESHWATER STRATIFICATION FEEDBACK

    Tabular Ice Island Melting (Freshwater Input)
                     │
                     ▼
    Low-Density Surface Freshwater Cap Forms in Baffin Bay / Labrador Sea
                     │
                     ▼
    Suppresses Deep Convection & Ocean Overturning (AMOC Weakening)
                     │
                     ▼
    Alters Regional Heat Transport & Modulates Arctic Weather Regimes
Oceanographic and Climatological Feedback Loops
The melting of an 8-to-10-gigaton ice island injects a massive pulse of cold, buoyant freshwater into the surface layers of the Labrador Sea and North Atlantic Subpolar Gyre. This freshwater capping strengthens upper-ocean stratification, preventing convective vertical mixing and disrupting regional nutrient upwelling that sustains Arctic marine food webs.
On a broader scale, sustained increases in freshwater discharge from Greenland glaciers weaken the Atlantic Meridional Overturning Circulation (AMOC), an ocean circulation system that regulates weather patterns across the Northern Hemisphere.
9. Future Milestones and Critical Glaciological Watchpoints
The calving of August 4, 2026, marks the beginning of an active transitional period for Petermann Glacier rather than its conclusion. Over the coming 12 to 36 months, glaciologists and oceanographers will track several critical milestones to determine whether Petermann enters an irreversible structural collapse:
               CRITICAL MILESTONES FOR PETERMANN GLACIER (2026–2030)

  [ Milestone 1: Fall 2026 – Spring 2027 ]
  Track propagation of Transverse Rift "R-1" (~94 km² slab) via SAR interferometry.
                      │
                      ▼
  [ Milestone 2: 2027 – 2028 Melt Seasons ]
  Monitor Grounding Line Retraction past the 500m retrograde bedrock ridge.
                      │
                      ▼
  [ Milestone 3: Post-Calving Flow Field Adjustments ]
  Measure upstream ice acceleration and dynamic thinning using ICESat-2 altimetry.
                      │
                      ▼
  [ Milestone 4: Fjord Hydrography & InSAR Commissioning ]
Deploy moored CTD arrays to record real-time Atlantic Water inflow variations.- Propagation of Rift R-1 (The Mid-Shelf Fracture): Located approximately 12 kilometers upstream from the new calving front, this rift spans over 60% of the ice shelf width. Sentinel-1 interferometry indicates that the strain rate at the crack tip is accelerating. If this fracture propagates across the remaining western margin, it will release an iceberg measuring 94 to 97 square kilometers, further exposing the inner fjord.
- Grounding Line Migration Past the Central Subglacial Sill: The central sector of Petermann’s grounding line currently rests on a narrow submarine ridge 500 meters below sea level. If ocean thermal forcing drives the grounding line off this ridge and down the retrograde (inward-sloping) bed, the retreat will become self-sustaining under Marine Ice Sheet Instability (MISI) physics.
- Upstream Velocity and Dynamic Thinning Response: Researchers utilizing NASA’s ICESat-2 laser altimeter and ESA’s CryoSat-2 will measure changes in surface elevation across the grounded portion of Petermann Glacier. A rapid drop in inland ice surface elevation will confirm that the loss of ice shelf buttressing has triggered widespread dynamic drawdown.
- Sub-Ice Ocean Cavity Hydrographic Profiling: The deployment of autonomous underwater vehicles (AUVs) and long-term moored Conductivity-Temperature-Depth (CTD) sensor arrays beneath the remaining ice tongue will provide the first continuous records of how tidal pumping modulates the flow of Atlantic Intermediate Water.
The Manhattan-sized ice island currently navigating the waters of northwest Greenland is a visible indicator of systemic transformation. The event confirms that the boundary between the ice sheet and the warming ocean is far more volatile and dynamic than previously understood, demanding that global sea-level projections account for the rapid, non-linear processes driving the demise of Earth's northern ice shelves.
Reference:
- https://www.islandinnovation.co/content/news/greenland-glacier-break-creates-new-ice-island
- https://gizmodo.com/greenland-glacier-break-creates-new-ice-island-the-size-of-manhattan-2000796484
- https://www.sciencedaily.com/releases/2026/08/260823094145.htm
- https://thedebrief.org/look-satellites-capture-dramatic-moment-a-manhattan-sized-iceberg-broke-away-from-a-greenland-glacier/
- https://www.facebook.com/benjaminhardmanphotography/videos/the-wildest-calving-event-ive-seendeep-in-the-fjords-of-east-greenland-we-witnes/1075402218272972/
- https://enewspaper.latimes.com/infinity/article_share.aspx?guid=3e13f7a5-fc97-4a48-8db6-611baf1bda9b
- https://sternaparadisaea.net/2023/08/10/no-petermann-glacier-is-not-growing/
- https://www.cambridge.org/core/journals/journal-of-glaciology/article/grounding-line-migration-from-1992-to-2011-on-petermann-glacier-northwest-greenland/7309C276E62C3B38C05CC4379A7C8028
- https://blogs.egu.eu/geolog/2023/08/04/a-chunk-of-ice-the-size-of-amsterdam-how-the-calving-of-greenlands-glaciers-has-changed-since-the-2010-petermann-glacier-event/
- https://tc.copernicus.org/articles/16/3021/2022/
- https://www.sciencedaily.com/releases/2026/08/260823094145.htm
- https://en.wikipedia.org/wiki/Petermann_Glacier
- https://www.facebook.com/earth.com/posts/massive-iceberg-breaks-away-from-greenlands-petermann-glacier-a-huge-section-of-/1501770451993470/
- https://scitechdaily.com/a-manhattan-sized-ice-island-just-broke-off-greenland/
- https://timesofindia.indiatimes.com/science/manhattan-sized-iceberg-just-broke-off-greenland-marking-petermann-glaciers-biggest-ice-loss-since-2012/articleshow/133463634.cms
- https://www.esa.int/Applications/Observing_the_Earth/Copernicus/Sentinel-1/Sentinel-1_captures_major_ice_loss_from_Greenland_glacier
- https://storymaps.arcgis.com/stories/23935729b9ac418cad29775fda25d713
- https://academiccommons.columbia.edu/doi/10.7916/d8-2dct-4293
- https://groce.de/en/research-background/the-79n-glacier/
- https://earth.org/section-of-greenland-ice-sheet-shatters-79n/
- https://www.hydro-international.com/content/article/mapping-northern-greenland-waters
- https://www.diva-portal.org/smash/record.jsf?pid=diva2:1752847
- https://www.facebook.com/AccuWeather/videos/incredible-moment-showing-iceberg-calving-in-greenland-resulting-in-a-thunderous/1340623214613689/
- https://www.pnas.org/doi/10.1073/pnas.2116036119
- https://www.smithsonianmag.com/smart-news/satellites-show-warming-tides-melting-a-massive-greenland-glacier-180982157/
- https://climate.copernicus.eu/esotc/2025/greenland-ice-sheet
- https://arctic.noaa.gov/report-card/report-card-2025/greenland-ice-sheet-2025/