The global quest to secure the critical minerals that power modern technology took a fundamental leap forward in late May 2026. Geoscientists successfully demonstrated a predictive model for mapping metals with earthquake waves, offering a precise global "treasure map" for the highly coveted materials that make smartphones, electric vehicles, and renewable energy infrastructure possible.
The breakthrough, published on May 22, 2026, in Nature Geoscience, is the culmination of a multi-year effort led by researchers at the University of Cambridge. By pairing a massive geochemical database of 9,000 rock samples with deep seismic imaging of the Earth's interior, the team revealed that rare earth elements (REEs) are not randomly distributed. Instead, they are systematically trapped along the steep, underground edges of the Earth’s oldest and thickest continental roots.
This discovery comes at a critical geopolitical moment. Currently, China controls approximately 70 percent of global rare earth extraction and 90 percent of its refining. With the United Kingdom, the United States, and the European Union lacking robust domestic supply chains, the ability to pinpoint these hidden metals deep underground is no longer just an academic triumph—it is a matter of economic and national security.
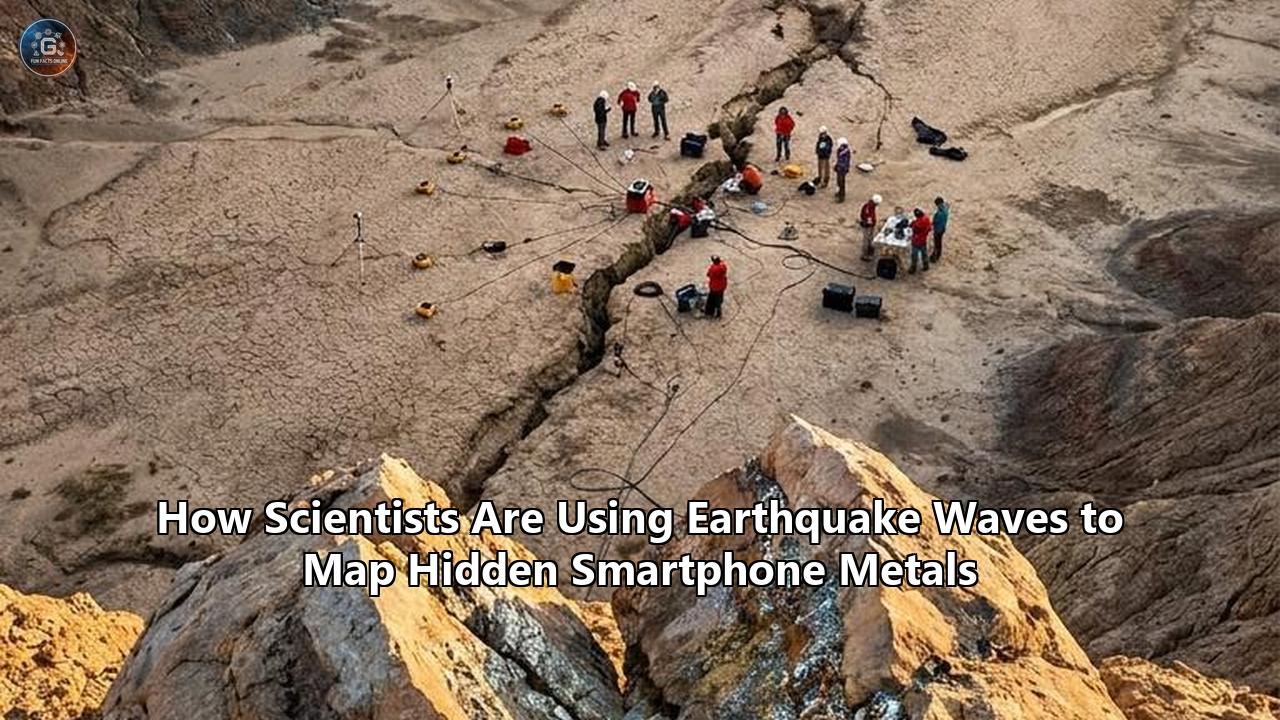
By utilizing the seismic waves generated by natural earthquakes, geophysicists can now look through kilometers of solid rock to identify the specific subterranean structures where these metals crystallized millions of years ago. This represents a profound shift in how the mining industry approaches exploration, transitioning from high-risk, "blind" drilling to highly targeted, non-invasive geophysics.
The Breaking Moment: The Deep Lithospheric Trap Revealed
The transition of seismology from a hazard-monitoring science to an exploration tool reached its peak with the publication of the Cambridge-led study. The research paper, titled "The global distribution of CO2-rich magmas is determined by lithospheric thickness," was authored by Emilie E. Bowman, Professor Sally A. Gibson, Dr. Siyuan Sui, and Professor Sergei Lebedev. It provides the first global-scale structural explanation for why rare earth deposits form in specific locations.
                     STEEP CRATONIC MARGIN (Transition Zone)
                  [Highly Targeted Exploration / ANT Surveys]
                                     |
    Thin Lithosphere (<90km)         |         Thick Cratonic Root (>140km)
   -------------------------         v        ------------------------------
  |                         |                |                              |
  |  Asthenosphere Melts    |   Carbonatites |  Mantle kept cool & rigid    |
  |  Rise rapidly; low REE  |   & REEs rise  |  under extreme pressure.     |
  |  concentration.         |   to surface.  |  Melting suppressed.         |
  |                         |                |                              |
   -------------------------                  ------------------------------
                                     ^
                                     |
                       Tiny CO2-rich pockets of magma
                       stall, stew, and concentrate REEs
                       at the base of the thick root.
The team’s method relies on seismic tomography, which uses the seismic waves of distant earthquakes to map the Earth's upper mantle, much like a medical CT scan maps the human body. "Using seismic waves from earthquakes, we can create a slice-through image of the lithosphere, much like a sonar can pick out features on the seabed," explained Professor Sergei Lebedev, a project co-lead and geophysicist at Cambridge Earth Sciences. "From this mapping we can see that lithospheric thickness plays a guiding role in where we find these deposits."
The lithosphere is the rigid outer shell of the Earth, encompassing the crust and the uppermost mantle. Beneath the oldest, undisturbed parts of the continents—known as cratons—the lithosphere extends like a deep, cold "root" down to depths of 200 kilometers or more.
The Cambridge team discovered that the thick roots of these cratons act as thermal and mechanical shields. They suppress widespread melting in the underlying convective mantle. However, under the high pressures and cool temperatures at the base of these roots, tiny, localized pockets of carbon-dioxide-rich mantle rock can melt. Because these melts represent less than one percent of the surrounding rock volume, they are highly enriched in volatile gases and "incompatible" elements—namely, the rare earth elements that do not easily fit into the crystal lattices of common rock-forming minerals.
These highly buoyant, CO2-rich magmas squeeze upward but eventually stall at the base of the thick lithospheric lid. There, they sit and "stew" for tens of millions of years, cooling slowly and allowing rare earth metals to concentrate to economically viable grades.
It is only when subsequent tectonic events—such as continental rifting or mantle plume activity—disturb these boundaries that these stalled, metal-rich magmas are forced to the surface. Crucially, they erupt along the steep edges of the cratons, where the thick lithosphere abruptly transitions to thinner crust.
By mapping metals with earthquake waves, geologists no longer have to guess where these ancient cratonic margins lie beneath kilometers of younger sedimentary cover. The seismic waves outline the exact geometry of the lithospheric roots, showing explorers precisely where to focus their surface search.
The Physical Paradox of Hard-Rock Seismology (Pre-2020)
To understand how scientists arrived at this breaking development, it is necessary to trace the long, difficult history of seismic imaging in mineral exploration. Historically, seismology was almost exclusively the domain of the oil and gas industry.
Oil and gas are hosted in sedimentary basins, which are characterized by broad, flat, parallel layers of sandstone, shale, and limestone. In these environments, active seismic exploration—where geophysicists detonate dynamite or use massive "vibroseis" trucks to send acoustic waves into the ground—is highly effective. The seismic waves travel downward, reflect off the horizontal rock interfaces, and return to surface geophones in clean, predictable patterns.
SEDIMENTARY BASIN (Oil & Gas)            HARD-ROCK METAMORPHIC/IGNEOUS (Minerals)
   [Predictable Reflections]                     [Extreme Wave Scattering]

       Vibroseis Truck                                Vibroseis Truck
            |                                              |
     =======v======= surface                        =======v======= surface
    |   Sediments   |                              /   \  / Fault \  /
    |---------------|                             / Fold\ \  Zone / /
    |   Sandstone   |                             |   |  \ \  |  / /
    |---------------|                             \ Ore / \ \ / /
    |   Limestone   |                              \___/   \_v_/
For hard-rock mineral exploration, however, seismology was long considered a physical impossibility. The metals needed for modern electronics—such as copper, nickel, cobalt, and rare earths—are typically found in crystalline, metamorphic, or igneous rock environments. These geologic settings are characterized by:
- Extreme structural deformation: Rocks are folded, faulted, sheared, and tilted at steep, near-vertical angles.
- High velocity contrasts: Crystalline rocks propagate seismic waves at incredibly high speeds (often exceeding 6,000 meters per second), leaving very little contrast between different rock units.
- Severe wave scattering: Instead of reflecting cleanly back to the surface, seismic waves hit irregular ore bodies, fault zones, and fractures, scattering in all directions like light reflecting off a shattered mirror.
- High attenuation and noise: Metamorphic terrains damp out high-frequency seismic waves, resulting in extremely poor signal-to-noise ratios.
Because of these limitations, mineral exploration companies historically avoided seismology. Instead, they relied on cheaper, lower-resolution potential field methods like gravity, magnetic, and electromagnetic (EM) surveys. While these methods are excellent for identifying broad anomalies (such as a highly magnetic body of iron ore), they suffer from a fundamental physical limitation: they cannot resolve depth accurately.
As the years progressed, easily accessible, outcropping mineral deposits at the surface were systematically exhausted. Mining companies were forced to look deeper, beneath hundreds of meters of barren "overburden" or post-mineralization sedimentary cover. At these depths, gravity and EM surveys lose their resolving power.
This technical challenge led to early, highly localized experiments in the 2010s to adapt reflection seismics for hard-rock settings. Pioneering projects at the Kylylahti copper-gold-zinc mine in eastern Finland and the Blötberget iron-oxide deposit in central Sweden demonstrated that high-frequency seismic arrays could, in fact, image sub-vertical ore bodies if the data processing was sufficiently advanced. However, these active seismic surveys required massive budgets, extensive permitting for explosives, and heavy machinery, making them commercially unviable for early-stage exploration.
Listening to the Hum: The Ambient Noise Revolution (2021–2023)
The first major turning point in this journey came with the transition from active seismic sources (explosives and vibrator trucks) to passive seismic imaging. Between 2021 and 2023, geophysicists began harnessing a physical phenomenon that had previously been discarded as useless background static: the Earth’s natural seismic hum.
Known as Ambient Noise Tomography (ANT), this passive seismic imaging method uses natural ground vibrations to map subsurface structures without the need for active, man-made seismic sources.
                             AMBIENT NOISE TOMOGRAPHY (ANT)

               Ocean Waves     Wind & Weather     Traffic/Industry
                    \                |                /
                     v               v               v
               ---------------------------------------------
              |          Background Seismic "Hum"            |
               ---------------------------------------------
                                     |
               ======================v====================== surface
                     [Node A]                 [Node B]
                        o                        o
                        |                        |
                         \______________________/
                            Cross-Correlation
                     (Extracts travel-time wave between nodes)
The Earth is never truly quiet. It is filled with a continuous, low-frequency seismic hum generated by several persistent sources:
- Ocean Microseisms: The relentless pounding of ocean waves on global coastlines sends continuous seismic waves rippling through the continental crust.
- Atmospheric Activity: Wind, storms, and pressure variations constantly rattle the surface of the planet.
- Anthropogenic Noise: Human activities, including highway traffic, heavy industry, and rail networks, create high-frequency surface vibrations.
For decades, seismologists viewed this ambient noise as a nuisance that obscured the clean signals of distant earthquakes. However, in the early 2000s, theoreticians proved that if one records continuous ambient noise at two separate sensors (Sensor A and Sensor B) and mathematically cross-correlates those signals over a long period, the random noise cancels out.
What remains is a clean seismic wave representing the exact travel time between the two sensors. This mathematical reconstruction, known as extracting the Green's Function, effectively turns Sensor A into a virtual earthquake source and Sensor B into the receiver.
By deploying arrays of hundreds of small, battery-powered seismic sensors (nodes) across an exploration site, geologists could record this background hum for several weeks. By cross-correlating the data from every possible sensor pair, they could construct detailed, three-dimensional shear-wave velocity ($V_s$) models of the subsurface.
The practical breakthrough of ANT in mineral exploration was accelerated by commercial innovation. In 2022, Australian space-technology company Fleet Space Technologies launched its "Exosphere" platform. Exosphere integrated lightweight, satellite-connected seismic sensors (which Fleet called "Geodes") with real-time cloud computing.
Instead of waiting months to retrieve geophones, download data, and manually process the waveforms, exploration teams could deploy an array of 100 Geodes over an area of several square kilometers. The nodes recorded continuous vertical-component seismic ambient noise, performed preliminary data compression and whitening on the edge, and transmitted the data via low-Earth-orbit satellites directly to the cloud for automated processing.
A major validation of this technology occurred at the Hillside Iron Oxide-Copper-Gold (IOCG) deposit in South Australia's Gawler Craton. In a 14-day deployment, 100 Geodes spaced 260 meters apart recorded ambient noise. The resulting 3D velocity model mapped the structural framework of the deposit down to a depth of one kilometer with unprecedented accuracy, successfully identifying the fault zones that controlled the high-grade copper mineralization.
Passive seismic imaging had officially proven its worth. It was low-cost, had zero environmental footprint (eliminating the need to clear land for vibrator trucks), and excelled at "seeing" through barren cover rocks to identify the faults and structures that host metals.
The REE-LITH Project: Connecting Mantle Physics to Chemistry (2024–2025)
While local exploration companies were using Ambient Noise Tomography to map copper and nickel deposits at depths of a few hundred meters, a grander scientific inquiry was taking shape in academic halls. Geophysicists and petrologists realized that to find the truly massive, world-class deposits of critical smartphone metals, they needed to zoom out. They needed to understand the deep, mantle-scale processes that generate these deposits in the first place.
In 2024, the UK’s Natural Environment Research Council (NERC) awarded a £1-million research grant to a multidisciplinary team at the University of Cambridge’s Department of Earth Sciences. The initiative, dubbed the REE-LITH project, was spearheaded by Professor Sally Gibson, a world-renowned igneous petrologist, and Professor Sergei Lebedev, a leading global seismologist.
Their goal was to test a bold, simple hypothesis: Could deep-earth seismic wave speeds predict the locations of rare earth elements at the surface?
For over 30 years, Professor Gibson had studied carbonatites—bizarre, ultra-rare volcanic rocks that are composed of more than 50 percent carbonate minerals (like calcite and dolomite) rather than the silicate minerals (like quartz and feldspar) that make up almost all other volcanic rocks.
Carbonatites are highly unusual because they are rich in carbon dioxide and host the world's largest concentrations of light rare earth elements, including:
- Neodymium (Nd) and Praseodymium (Pr): Essential for making the ultra-strong neodymium-iron-boron (NdFeB) permanent magnets used in smartphone vibration motors, speakers, and microphones.
- Dysprosium (Dy) and Terbium (Tb): Added to magnets to allow them to retain their magnetic properties at high operating temperatures.
- Lanthanum (La) and Cerium (Ce): Used in smartphone camera lenses to improve refractive index and reduce distortion, as well as in battery anodes.
Historically, carbonatites were viewed as geological oddities. "Carbonatites have long been seen as geological curiosities, things that no one was that interested in in terms of big-picture science," Gibson noted in early 2025. But as the global clean energy transition and the smartphone boom accelerated, finding these rocks became a multi-billion-dollar priority.
                                 REE-LITH METHODOLOGY

      GEOCHEMICAL DATABASE                             SEISMIC TOMOGRAPHY
 [9,000 global igneous samples]                 [Global earthquake wave models]
               |                                               |
               v                                               v
       Chemical sorting                                  Physical sorting
(CO2-rich carbonatites, basanites, etc.)          (Lithospheric thickness & Vs profiles)
               \                                               /
                \_____________________________________________/
                                       |
                                       v
                          Predictive Global Atlas:
                  REEs cluster at lithospheric depths of
                  95-140 km along steep cratonic boundaries.
The REE-LITH project was inspired by a classic geological relationship in the diamond trade. For over a century, geologists have known that diamonds are only found in a volcanic rock called kimberlite, which erupts exclusively through the oldest, thickest parts of continental crust (cratonic cores). The deep "roots" of these cratons provide the extreme, high-pressure, low-temperature conditions required for carbon to crystallize as diamond rather than graphite.
Gibson hypothesized that carbonatites might have a similar, systematic relationship with the thickness of the Earth’s rigid outer shell.
To prove this, the team split into two groups. The geochemists, led by PhD researcher Emilie Bowman, began compiling a massive, quality-controlled database of chemical analyses from approximately 9,000 CO2-rich igneous rock samples collected worldwide over the past century.
Simultaneously, the geophysicists, led by Lebedev and Dr. Siyuan Sui, constructed a state-of-the-art seismic tomographic model of the Earth's lithosphere. They analyzed millions of seismograms from global earthquake networks, focusing on the dispersion of surface waves (Rayleigh and Love waves).
Because Rayleigh and Love waves travel at different speeds depending on the temperature and rigidity of the rocks they pass through, the team could calculate the precise shear-wave velocity ($Vs$) structure of the upper mantle. They then converted these velocity profiles into thermodynamic models to map the exact boundary where the cold, rigid lithosphere meets the hot, ductile asthenosphere—effectively measuring the thickness of the continents on a global scale.
Decoding the Lithosphere's Trap (May 2026)
By May 2026, the two halves of the puzzle were complete. When Emilie Bowman plotted the coordinates of the 9,000 geochemical samples onto Sergei Lebedev’s global lithospheric thickness map, the results revealed a remarkably orderly progression.
                                LITHOSPHERIC GRADIENT

       < 90 km             80 - 120 km           95 - 140 km          > 140 km
  +---------------+    +-----------------+    +---------------+    +--------------+
  |   Basanites   |    |  Nephelinites   |    | Carbonatites  |    | Kimberlites  |
  | (Low CO2/REE) |    |  & Melilitites  |    |  (Max REEs)   |    |  (Diamonds)  |
  +---------------+    +-----------------+    +---------------+    +--------------+
The type of volcanic rock that erupted at the surface was strictly governed by the thickness of the rigid continental plate beneath it:
- Basanites (the least carbon-rich and mineralogically simple of the group) erupted exclusively through thin lithosphere, measuring less than 90 kilometers thick.
- Nephelinites and Melilitites (intermediate rocks with higher volatile contents) favored moderately thick crustal lids between 80 and 120 kilometers.
- Carbonatites (the primary hosts of global rare earths) clustered with striking precision where the lithospheric thickness was between 95 and 140 kilometers, with a median of 114 kilometers.
- Kimberlites (the host rocks for diamonds) were restricted to the deepest continental roots, where the lithosphere exceeded 140 kilometers.
This orderly progression exists because of the unique physics and chemistry of the mantle boundary. Under a thin continental plate (less than 90 kilometers), mantle rocks can rise easily, depressurize, and undergo extensive melting. This produces vast volumes of common silicate magmas, such as basalt, which dilutes any rare earth elements present.
Under an exceptionally thick plate (greater than 140 kilometers), the cold cratonic root keeps the mantle so cold and compressed that melting is almost entirely suppressed.
The "Goldilocks zone" for rare earth elements lies in the transition zone—where the lithospheric root is between 95 and 140 kilometers thick. Here, the plate is thick enough to suppress large-scale melting, but thin enough to allow tiny, volatile-rich melts to form.
These tiny magmas are saturated with dissolved carbon dioxide, which acts as a powerful solvent, stripping the surrounding mantle of its rare earth elements. As these CO2-rich melts rise, they hit the impenetrable base of the lithospheric root and stall.
Over millions of years, this stalling creates a natural "stewing pot". As the magma cools slowly, minerals that do not want rare earths crystallize first, leaving behind a residual melt that is incredibly concentrated in smartphone metals.
When subsequent tectonic rifting or continental breakup occurs, the steep margins of these thick cratonic roots act as structural funnels. The stalled, REE-rich carbonatites are squeezed upward along major crustal faults, erupting onto the surface where they can eventually be mined.
The implications of this discovery for the mining sector are immense. Instead of exploring vast, continent-sized areas, geologists can use mapping metals with earthquake waves to identify the precise corridors where the lithosphere thins from 140 kilometers to 90 kilometers. These steep underground slopes are the high-priority targets for finding the next generation of smartphone metal deposits.
Industrial Escalation: Real-World Adoption (Late May 2026)
The transition of this scientific breakthrough from academic journals to active field deployment occurred almost instantly. In late May 2026, major mining hubs and exploration companies began announcing massive programs designed to leverage these deep seismic insights.
The Nisk Project, Quebec (May 27, 2026)
On May 27, 2026, Canadian explorer Power Metallic Mines Inc. announced a significant expansion of its summer exploration program at its flagship Nisk Project in Quebec. The property is highly prospective for nickel, copper, and platinum group elements (PGE)—the critical battery and structural metals that accompany smartphone manufacturing.
                             NISK PROJECT EXPLORATION ARRAY
                                   (Quebec, Canada)

               [Direct-to-Satellite Gateway]
                            ^
                            |
       =====================|===================== surface
         o (Node)        o (Node)        o (Node)
         |               |               |
         \_______________|_______________/
                         |
                         v
         [Ambient Noise Tomography (ANT) Survey]
         - Continuous 3D Shear-Wave velocity (Vs) profiling
         - Target: Detect ultra-mafic rock conduits at depth
Building on a newly launched muon tomography program, Power Metallic announced it was deploying Ambient Noise Tomography (ANT) across its Nisk Far West target. By placing arrays of passive seismic sensors across the property, the company is using natural ground vibrations to map the subsurface shear-wave velocity structures down to several hundred meters.
This local-scale passive seismic mapping matches the deep cratonic margins mapped by global earthquake waves. By combining the two scales of seismic imaging, Power Metallic can trace the deep structural conduits that allowed metal-rich ultramafic magmas to rise from the mantle and deposit high-grade nickel and copper sulfides near the surface.
India's National Critical Mineral Mandate (May 26, 2026)
A parallel, nation-scale development unfolded in New Delhi on May 26, 2026. G. Kishan Reddy, India’s Union Minister for Coal and Mines, issued an urgent directive to all national exploration agencies to adopt a "mission-mode" approach to secure the country's mineral independence.
The Ministry of Mines designated rare earth elements, lithium, cobalt, nickel, and platinum group elements as the nation's highest-priority strategic minerals.
As part of this push, the Geological Survey of India (GSI) unveiled a five-year roadmap covering large-scale mapping and AI-enabled exploration over nearly 48,000 square kilometers. A cornerstone of this initiative is the deployment of widespread seismic monitoring systems managed by the National Institute of Rock Mechanics.
By analyzing seismic waves traveling through India's ancient Dharwar Craton—one of the oldest continental blocks on Earth—Indian geophysicists are mapping the deep lithospheric boundaries to identify hidden deposits of gold, copper, and rare earths beneath thick soil cover.
========================================================================================
EXPLORATION STAGES: FROM DEEP EARTHQUAKES TO LOCAL DRILL TARGETS
========================================================================================

Stage 1: Deep Seismic Tomography (Global/Continental Scale)
  - Source: Natural earthquakes.
  - Array: Permanent global seismometer networks.
  - Physics: Rayleigh and Love surface wave dispersion.
  - Resolution: 10 - 50 km lateral grid.
  - Output: Identifies "steep cratonic boundaries" (Lithosphere transition zones).

Stage 2: Local Ambient Noise Tomography (Prospect Scale)
  - Source: Ocean hum, wind, local traffic.
  - Array: 100 - 500 passive Geodes spaced 250m apart.
  - Physics: Cross-correlation of background noise to extract Vs models.
  - Resolution: 10 - 50 meters lateral grid down to 1 km depth.
  - Output: Maps actual fault structures, shear zones, and alteration packages.

Stage 3: Targeted Precision Drilling (Deposit Scale)
  - Source: Diamond core drill rigs.
  - Output: Confirms grade and metallurgy of the target ore body.
========================================================================================
Technical Comparison: Traditional vs. Seismic Exploration
To fully appreciate how mapping metals with earthquake waves is restructuring the exploration sector, it is useful to compare it to the traditional geophysical tools that have dominated the industry for the past half-century.
Historically, mining companies relied heavily on airborne magnetic and gravity surveys. While these methods are fast and cost-effective, they are limited by the physical law of inverse-power decay: the strength of gravity and magnetic fields decreases rapidly with distance from the source.
This means that as a mineral deposit is buried deeper beneath post-mineralization cover, its magnetic and gravitational signature at the surface becomes incredibly faint and smeared out.
Seismic waves do not suffer from this limitation. Because seismic energy travels through the rock as a physical wave, its resolving power at depth is unmatched by potential field methods.
| Geophysical Method | Primary Physical Property Measured | Depth Resolution | Environmental Impact | Operational Speed | Limitations |
|---|---|---|---|---|---|
| Magnetics | Magnetic susceptibility of rocks | Poor at depth (inverse-power decay) | Very Low (Airborne) | Extremely Fast | Highly vulnerable to surface noise; cannot resolve exact depth |
| Gravity | Density contrasts | Moderate at depth | Very Low (Airborne/Ground) | Fast | Non-uniqueness of depth-to-source estimates |
| Electromagnetics (EM) | Electrical conductivity | Moderate (typically limited to <500m) | Low | Fast | Heavily shielded by conductive clay overburden |
| Active Seismic | P-wave and S-wave reflectivity | High (down to several km) | High (requires explosives/heavy trucks) | Slow (intensive line-clearing) | Extremely expensive; logistically complex in rough terrain |
| Ambient Noise Tomography (ANT) | Shear-wave velocity ($Vs$) | High (typically up to 1-2 km) | Extremely Low (passive hand-placed nodes) | Fast (real-time satellite telemetry) | Requires minimum 7-14 days of continuous background recording |
| Earthquake Wave Tomography | Global/Continental Shear-wave velocity ($Vs$) | Excellent (Mantle-scale, 50-250 km) | Zero (uses natural earthquakes) | Continuous (permanent networks) | Coarse regional resolution; requires secondary local surveys to target drills |
By utilizing mapping metals with earthquake waves at a regional scale to narrow down the target zone, and then deploying Ambient Noise Tomography at a local scale, mining companies can create a seamless, 3D structural model of the crust. This combined approach allows them to identify:
- The deep mantle conduits where CO2-rich, metal-bearing magmas were generated.
- The lithospheric faults that guided these magmas toward the surface.
- The shallow trap structures (folds, fault offsets) where the ore crystallized into economic concentrations.
This level of structural resolution reduces exploration drilling requirements by up to 90 percent, saving millions of dollars in capital and dramatically reducing the environmental footprint of mining exploration.
Unresolved Questions and the Horizon Forward
Despite the monumental success of the Cambridge study, the geoscientific community faces several unresolved questions as they look to operationalize these models globally.
The primary limitation of the May 2026 Nature Geoscience model is that it was restricted to volcanic rocks younger than 200 million years. The team chose this restriction because plate tectonics is an incredibly active, destructive process.
Over hundreds of millions of years, continental collisions, subduction, rifting, and mountain-building churn up, deform, and erode the crust. This geologic noise makes the ancient lithosphere highly complex and difficult to reconstruct.
However, this temporal limitation poses a challenge for explorers. Many of the world’s most economically significant rare earth mines are hosted in rocks that are vastly older than 200 million years:
- Bayan Obo (Inner Mongolia, China): The largest rare earth deposit in the world, which hosts over 40 million tons of REE reserves, is Mid-Proterozoic, having formed approximately 1.4 billion years old.
- Mountain Pass (California, USA): The premier North American REE deposit was formed during the Mesoproterozoic, roughly 1.4 billion years ago.
- Mount Weld (Western Australia): A major global producer of neodymium and praseodymium, associated with a carbonatite that is approximately 2.0 billion years old.
If the relationships identified by the Cambridge team are to be used to find another Bayan Obo or Mountain Pass, the seismic models must be pushed much further back in time.
                                  FUTURE TIMELINE

        May 2026                       2027 - 2028                     2029+
  +------------------+             +------------------+         +------------------+
  |  Nature Geo.     |             |  REE-LITH Phase  |         |  Global Seismic  |
  |  Publication     |  ========>  |  II Expansion    |  ====>  |  Predictive Map  |
  | (Rocks <200 Ma)  |             | (Ancient Rocks)  |         | (Deep Proterozoic|
  |   |             |   |         |   Cratons Map)   |
  +------------------+             +------------------+         +------------------+
"Now we have established this systematic behavior exists, we can go back further in time," Professor Gibson noted, looking to the next phase of the REE-LITH project. "It's going to be more challenging, but I'm hopeful that this will be a key step in predicting mineral occurrences."
To map these ancient deposits, geophysicists are developing thermodynamic inversions that integrate seismic wave speeds with computational petrology.
By calculating how temperature, pressure, and chemical composition affect seismic velocity over billions of years, researchers hope to peel back the layers of tectonic deformation. This will allow them to reconstruct what the continents looked like when these ancient carbonatite "stewing pots" first formed.
Furthermore, as machine learning models become more sophisticated, they are being trained to automatically recognize these deep-seated seismic patterns.
By feeding global seismic datasets, gravity maps, and satellite hyperspectral data into deep neural networks, AI can generate probabilistic rankings of drill targets across entire continents. This integration promises to compress the mineral discovery timeline from a historical average of 10 to 15 years down to just a few months.
The New Map of Tech Sovereignty
The ultimate legacy of mapping metals with earthquake waves extends far beyond academic curiosity. We live in an era where the supply chains for advanced semiconductors, national defense technologies, and consumer electronics are highly centralized and fragile. A single disruption in rare earth processing can halt the manufacturing of smartphones and electric vehicles worldwide.
By demonstrating that the deep, structural roots of the continents hold the key to where these metals are deposited, geophysicists have handed western nations a powerful new tool.
Whether mapping the deep margins of the Laurentian Craton in northern Canada, the Dharwar Craton in India, or the ancient margins of the Baltic Shield, the Earth's natural seismic waves are lighting up the dark interior of our planet.
The next giant rare earth deposit is no longer an invisible needle in a continental-sized haystack. It is a clearly defined seismic signature waiting to be uncovered along the ancient, buried edges of the world.
Reference:
- https://www.sciencedaily.com/releases/2026/05/260525000450.htm
- https://www.cam.ac.uk/research/news/scientists-map-rocks-with-rare-earth-element-potential-helping-pinpoint-new-deposits
- https://www.tun.com/home/cambridge-scientists-map-rare-earth-elements-in-rock-deposits/
- https://scitechdaily.com/scientists-uncover-hidden-rare-earth-treasure-map-beneath-ancient-continents/
- https://www.cam.ac.uk/research/news/new-global-map-promises-to-better-pinpoint-vital-rare-earth-deposits
- https://www.mdpi.com/2075-163X/14/3/254
- https://farmonaut.com/mining/seismic-imaging-for-mineral-deposits-2025-breakthroughs
- http://www.sciencedaily.com/releases/2026/05/260525000450.htm
- https://scitechdaily.com/scientists-uncover-hidden-rare-earth-treasure-map-beneath-ancient-continents/
- https://scienceblog.com/the-strange-rocks-that-could-loosen-chinas-grip-on-rare-earths/
- https://africanminingmarket.com/we-need-to-find-more-copper-than-ever-over-the-next-10-years/25789/
- https://www.researchgate.net/publication/322636584_Seismic_imaging_of_the_Kylylahti_Cu-Au-Zn_ore_deposit_using_conventinal_and_DAS_VSP_measurements_supported_by_3D_full-waveform_seismic_modeling
- https://pubs.geoscienceworld.org/segweb/segdiscovery/article/doi/10.5382/SEGnews.2025-140.fea-01/651695/Ambient-Noise-Tomography-A-Sensitive-Rapid-Passive
- https://www.fleetspace.com/resources/ant-for-mineral-exploration-uncovered
- https://www.researchgate.net/publication/365873696_Seismic_Exploration_Solutions_for_Deep-Targeting_Metallic_Mineral_Deposits_From_high-fold_2D_to_sparse_3D_and_deep-learning_workflows
- https://www.earthdoc.org/content/papers/10.3997/2214-4609.202520180
- https://www.mining.com/sponsored-content/eminent-announces-positive-results-from-seismic-survey-at-hot-springs-range-project-nevada/
- https://research-portal.uu.nl/en/publications/3d-velocity-modelling-for-mineral-exploration-via-ambient-noise-t/
- https://www.cam.ac.uk/research/news/scientists-map-rocks-with-rare-earth-element-potential-helping-pinpoint-new-deposits
- https://meetingorganizer.copernicus.org/EGU25/EGU25-9976.html
- https://scienceblog.com/the-strange-rocks-that-could-loosen-chinas-grip-on-rare-earths/
- https://www.prnewswire.com/news-releases/power-metallic-mines-expands-exploration-arsenal-with-cutting-edge-geophysical-surveys-at-nisk-project-302782497.html
- https://energy.economictimes.indiatimes.com/news/coal/g-kishan-reddy-pushes-for-mission-mode-mining-of-critical-mineral-projects/131328840
- https://discoveryalert.com.au/critical-minerals-india-mission-mode-mining-vulnerability-2026/
- https://geotomographie.de/applications/deep-tomography-3/
- https://www.nv5geospatialsoftware.com/Learn/Whitepapers/Whitepaper-Detail/critical-minerals-renewed-exploration-with-hyperspectral-remote-sensing