
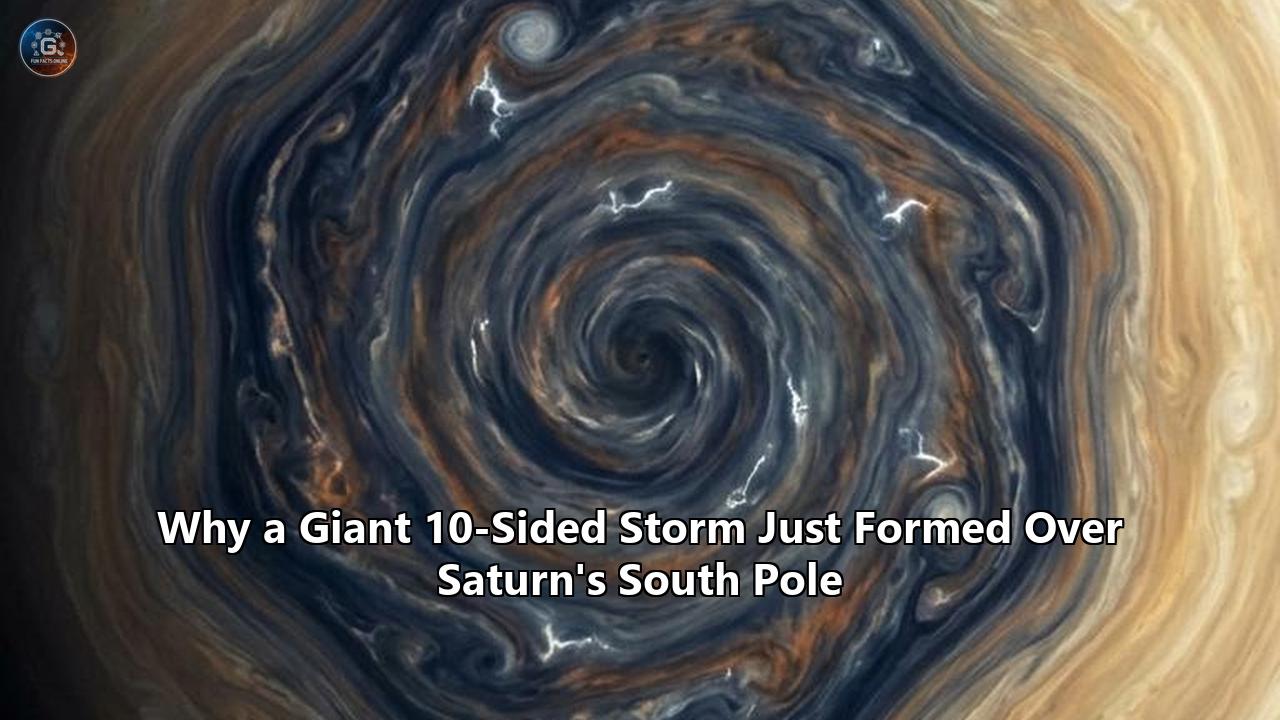
Astronomers monitoring the outer solar system have detected a massive, evolving ten-sided atmospheric wave encircling Saturn’s southern polar region. The discovery, confirmed through high-resolution imaging from NASA’s Hubble Space Telescope and detailed in Science Advances, documents the emergence of a colossal decagonal jet stream at approximately 60 to 63 degrees south latitude. Spanning roughly 167,800 kilometers in circumference—with each of its ten distinct sides stretching over 16,700 kilometers—the structure represents the first persistent, regular geometric wave ever documented in Saturn's southern hemisphere.
The identification of this new Saturn south pole storm challenges forty years of atmospheric physics assumptions. Ever since NASA’s Voyager 1 and Voyager 2 flybys revealed a six-sided hexagonal jet at Saturn’s north pole in 1980 and 1981, scientists considered the northern structure a planetary anomaly with no southern equivalent. Decades of continuous orbital reconnaissance by the Cassini spacecraft between 2004 and 2017 found no evidence of a stable southern polygon, recording only a circular hurricane-like vortex directly over the pole.
Data collected between 2023 and 2025 by Hubble’s Outer Planet Atmospheres Legacy (OPAL) program, cross-referenced with ground-based imaging by an international network of observers, confirms that the southern decagon is not a legacy feature that went unnoticed, but an entirely new meteorological system actively developing in real time.
The emergence of a 10-sided wave demonstrates that geometric jet stream patterns are intrinsic, repeatable properties of deep gas giant atmospheres rather than isolated northern oddities. As the system continues to strengthen and drift, its observation provides researchers an unprecedented opportunity to track the birth, stabilization, and physics of planetary-scale fluid instability from inception.
===================================================================================
                  GEOMETRIC PROFILE: NORTHERN VS. SOUTHERN JET WAVES
===================================================================================
Parameter                     Northern Hexagon              Southern Decagon
-----------------------------------------------------------------------------------
Dominant Geometry             6-sided polygon (Hexagon)     10-sided polygon (Decagon)
Planetary Latitude            ~78.5° North                  ~60.0°–63.0° South
First Confirmed Detection     1980 (Voyager 1)              2023–2025 (Hubble/OPAL)
Estimated Circumference       ~96,000 km                    ~167,820 km
Length per Side               ~14,500 km                    ~16,782 km
Zonal Jet Wind Speed          ~360 km/h                     ~400–420 km/h
Pattern Drift Speed           ~0 km/h (Stationary)          ~10 km/h (Eastward drift)
Atmospheric Longevity         45+ years (Stable)            Developing / Dynamic
Associated Trigger Feature    Internal deep convection      55°S Anticyclonic Vortex
===================================================================================
Observational Timeline and Discovery Mechanics
The decagon remained hidden for over a decade primarily due to Saturn's orbital geometry. Saturn takes 29.5 Earth years to complete one orbit around the Sun, tilted on an axial inclination of 26.7 degrees. From 2012 to 2023, the planet’s southern pole tilted away from Earth, preventing ground-based observatories and near-Earth space telescopes from inspecting high southern latitudes. Following the intentional de-orbit of the Cassini spacecraft into Saturn’s atmosphere in September 2017, human surveillance of the ringed planet dropped to zero in-situ coverage.
When Saturn’s south pole tilted back into terrestrial view in early 2023, astronomers activated regular monitoring programs. Initial Hubble OPAL imaging captured faint, undulating disturbances in the southern subpolar jet. By mid-2024, ground-based planetary observers Trevor Barry at the Broken Hill Observatory in Australia and Jean-Paul Oger of the French Astronomy Association detected anomalous, non-axisymmetric dark ripples near 60 degrees south. These observations were routed through the Planetary Virtual Observatory Laboratory (PVOL), a global open-access repository hosted by the University of the Basque Country.
Lead researcher Agustín Sánchez-Lavega, an atmospheric physicist at the University of the Basque Country, coordinated follow-up observations using Hubble's Wide Field Camera 3 (WFC3). Processing multi-band exposures taken on August 29, 2025, the research group reconstructed high-resolution polar orthographic projections. The data resolved ten linear wave segments organized into a near-regular decagon wrapped around the subpolar circumference.
Multi-filter imaging using both continuum wavelengths (763 nanometers) and deep methane absorption bands (889 nanometers) established that the decagon is not a superficial smudge in the upper haze layer. The wave extends across multiple vertical scale heights, spanning from the upper troposphere into the lower stratosphere. The ten vertices alter their apparent morphology across different atmospheric pressure regimes, confirming that the Saturn south pole storm functions as a coherent three-dimensional meteorological column rooted deep within the convective envelope.
2012–2022: South pole tilted away from terrestrial line of sight; Cassini ends mission in 2017.
   │
Early 2023: Saturn's axial tilt brings south pole into view; Hubble OPAL records initial ripples.
   │
Mid-2024: PVOL network amateur observers identify persistent dark wave bands near 60°S.
   │
Aug 2025: Hubble WFC3 captures definitive multi-spectral imagery confirming 10-sided polygon.
   │
Sep 2026: Sánchez-Lavega et al. publish comprehensive fluid dynamics study in Science Advances.
Anatomy and Kinematics of the Southern Decagon
The physics driving the southern decagon differ notably from the northern hexagon. The northern feature sits closer to the pole at 78.5 degrees north, trapped within a narrow, high-latitude eastward jet stream that has maintained near-total positional and rotational stability relative to Saturn's internal radio rotation rate for over four decades.
In contrast, the newly observed southern structure is wider, faster, and dynamic:
- Zonal Jet Mechanics: The southern decagon is embedded within a high-velocity eastward jet stream blowing at 400 to 420 kilometers per hour (110 to 117 meters per second) at 60–63°S.
- Slow Drift Velocity: The 10-sided wave pattern does not lock synchronously to the local wind speeds. Instead, the planetary Rossby wave drifts eastward at roughly 10 kilometers per hour (2.8 meters per second) relative to the planet's deep interior, requiring approximately 800 Earth days to complete a single rotation around Saturn.
- Vertex Asymmetry: Unlike the northern hexagon, where all six vertices share nearly identical optical depths and sharp angles, the southern decagon shows distinct variations in clarity. Analysis shows three sectors exhibit crisp, sharp corners; four sectors display moderate curvature; and three sectors remain diffuse and meandering.
- Radial Oscillations: Time-series mapping reveals that the vertices undergo radial oscillations with a periodic cycle of roughly 32 Earth days, moving inward and outward relative to the rotational axis.
- Physical Scale: The diameter of the decagon ring exceeds 104,000 kilometers, comfortably fitting eight Earths side-by-side inside its perimeter.
                                  60°S JET STREAM
                         ~~~~~~~~~~~~~~~~~~~~~~~~~~~~~~~~
                                  /            \
                       Side 1    /              \   Side 2
                                /   Decagon Core \
                         ======*                  *======
                        /                                \
                 Side 10\                                / Side 3
                         *       SATURN SOUTH POLE       *
                        /             (0° LAT)            \
                 Side 9 \                                / Side 4
                         ======*                  *======
                                \                /
                        Side 8   \              /   Side 5
                                  \   Side 6   /
                         ~~~~~~~~~~~~~~~~~~~~~~~~~~~~~~~~
                                55°S ANTICYCLONE
The Trigger Mechanism: The 55° South Anticyclonic Vortex
Why did a structured 10-sided polygon form now, after decades of absence? Planetary meteorologists point to an intense vortex interaction observed at adjacent latitudes.
Images captured throughout 2023 and 2024 revealed an isolated, compact anticyclonic storm system located at approximately 55 degrees south latitude—just equatorward of the subpolar jet. Measuring approximately 4,000 kilometers across, this vortex darkened dramatically between late 2024 and mid-2025, indicating strong upwelling of phosphine, hydrocarbons, and ammonia ice from deeper convective reservoirs.
                     BAROTROPIC INSTABILITY CASCADE
  ┌─────────────────────────────────────────────────────────────────┐
  │ 1. Compact 4,000 km Anticyclone intensifies at 55°S             │
  └───────────────────────────────┬─────────────────────────────────┘
                                  ▼
  ┌─────────────────────────────────────────────────────────────────┐
  │ 2. Deep convective upwelling injects localized potential        │
  │    vorticity into the adjacent southern subpolar eastward jet   │
  └───────────────────────────────┬─────────────────────────────────┘
                                  ▼
  ┌─────────────────────────────────────────────────────────────────┐
  │ 3. Jet exceeds Rayleigh-Kuo threshold: dn²(u)/dy² changes sign │
  └───────────────────────────────┬─────────────────────────────────┘
                                  ▼
  ┌─────────────────────────────────────────────────────────────────┐
  │ 4. Meandering wave develops and locks into an azimuthal         │
  │    wavenumber m=10 resonant standing pattern                    │
  └───────────────────────────────┬─────────────────────────────────┘
                                  ▼
  ┌─────────────────────────────────────────────────────────────────┐
  │ 5. Fully developed 10-sided Decagonal Jet stabilizes at 60–63°S  │
  └─────────────────────────────────────────────────────────────────┘
The physical proximity between this localized storm and the subpolar jet is direct:
- Vorticity Injection: The 55°S anticyclone acted as an atmospheric perturbator, deflecting the eastward current southward and injecting localized vorticity into the high-speed jet stream.
- Wave Resonance: Rather than dissipating into turbulent eddies, the continuous kinetic energy feeding into the jet triggered a planetary-scale Rossby wave.
- Wavenumber Selection: Because the jet stream at 60°S possesses a larger radius and distinct velocity shear compared to the 78°N jet, the system resonated at an azimuthal wavenumber of $m = 10$ instead of $m = 6$.
- Structural Asymmetry Correlation: The decagon’s sharpest, most well-defined vertices occur along the latitudinal quadrant directly adjacent to the 55°S vortex, confirming that the storm functions as an ongoing wave driver.
Who Is Affected and What Changes in Planetary Science
The discovery of a second, structurally distinct geometric storm alters theoretical models, observational priorities, and institutional methodologies across astrophysics and planetary meteorology.
===================================================================================
                   STAKEHOLDER IMPACT & OPERATIONAL ADJUSTMENTS
===================================================================================
Stakeholder Group                 Direct Impact               Operational Change
-----------------------------------------------------------------------------------
Atmospheric Physicists &          Overturns static models     Update GCM simulations to
Fluid Dynamicists                 of outer-planet jets        incorporate transient Rossby
                                                              wavenumber transitions.

Space Agency Mission Planners     Alters payload requirements Design deep-atmosphere sounders
(NASA, ESA, JAXA)                 for future outer-planet     and long-baseline orbiters
                                  flagship architectures      for Uranus/Neptune missions.

Telescope Time Allocation         Re-evaluates multi-epoch    Fast-track Cycle 36+ Hubble
Committees (STScI, JWST)          outer solar system imaging  and JWST polar allocations
                                  allocations                 to capture temporal shifts.

Amateur Astronomer Networks       Elevates ground-based       Institutionalize real-time
(PVOL, ALPO, SAF)                 planetary tracking to       alert pipelines between amateur
                                  critical surveillance       arrays and major observatories.
===================================================================================
1. Re-Evaluation of Atmospheric Instability Models
For decades, atmospheric dynamicists questioned whether Saturn’s northern hexagon was created by boundary conditions unique to the northern hemisphere—such as subsurface topography, hidden localized thermal hot spots, or asymmetric core coupling. The emergence of the southern decagon confirms that polygon formation is an intrinsic property of sheared zonal jets in deep, rapidly rotating atmospheres.
Global Circulation Models (GCMs) must now simulate transitions between axisymmetric zonal flows and discrete polygonal wavenumbers ($m=3$ through $m=10$) without relying on ad-hoc boundary forces.
2. Disruption of Space Telescope Observation Schedules
The dynamic, evolving state of the southern decagon has triggered urgent requests for follow-up observations. Because the structure shows signs of rapid growth and vertex shifting, static annual snapshots are insufficient. Space Telescope Science Institute (STScI) schedulers are allocating expanded target-of-opportunity and scheduled monitoring windows across Hubble Cycle 34/35 and JWST Cycle 4/5.
3. Formal Integration of Amateur Observational Arrays
The pivotal role played by amateur astronomers operating through PVOL highlights a structural gap in solar system surveillance. With no active orbiters around Saturn, Uranus, or Neptune, major space agencies cannot maintain continuous temporal coverage. Ground-based tracking networks have proven essential for alerting agency telescopes to planetary anomalies before transient phenomena disappear.
Fluid Dynamics: The Physics of Atmospheric Polygons
To understand why a 10-sided shape emerged over Saturn's south pole, fluid dynamicists apply the principles of barotropic and baroclinic instability within a rotating reference frame.
                         THE ROSSBY $\beta$-PLANE MODEL
===================================================================================
                               Equatorward (Lower Latitude)
                                      |
                                      v
                             [ + Vorticity Shear ]
           -----> ------> ---------> Jet Core (420 km/h) ---------> ------> ----->
                             [ - Vorticity Shear ]
                                      ^
                                      |
                                Poleward (High Latitude)
===================================================================================
Potential Vorticity Conservation and the Charney-Stern Criterion
Saturn’s atmosphere behaves as a shallow fluid layer draped over a rapidly rotating, metallic hydrogen and molecular hydrogen mantle. The fundamental governing equation is the conservation of absolute potential vorticity ($q$):
$$q = \frac{\zeta + f}{H} = \text{constant}$$
Where:
- $\zeta$ is relative vorticity ($\nabla \times \mathbf{u}$, the local spin of the fluid).
- $f = 2\Omega \sin\phi$ is the Coriolis parameter, dependent on planetary rotation rate $\Omega$ and latitude $\phi$.
- $H$ represents effective scale height or fluid column thickness.
When wind speeds across an eastward jet vary steeply with latitude, a strong horizontal velocity shear $\frac{\partial u}{\partial y}$ forms. According to the Rayleigh-Kuo and Charney-Stern stability criteria, an atmospheric jet becomes unstable and forms undulating waves when the meridional gradient of absolute vorticity changes sign within the flow:
$$\beta - \frac{\partial^2 u}{\partial y^2} = 0$$
Where $\beta = \frac{\partial f}{\partial y} = \frac{2\Omega \cos\phi}{R_S}$ is the planetary vorticity gradient, and $R_S$ is Saturn’s equatorial radius (60,268 km).
                      WAVENUMBER FORMATION BY LATITUDE
  Polar Region (78.5°N):
  - Smaller radius (R_local ~12,000 km)
  - Lower β-effect (cos 78.5° = 0.20)  ======> Resonant Mode: m = 6 (Hexagon)
  - Narrow jet profile

  Subpolar Region (61°S):
  - Larger radius (R_local ~29,000 km)
  - Higher β-effect (cos 61.0° = 0.48)  ======> Resonant Mode: m = 10 (Decagon)
  - Broad, high-shear jet profile
Why a Decagon Instead of a Hexagon?
The selection of wavenumber $m = 10$ at 60°–63°S versus $m = 6$ at 78.5°N comes down to three physical constraints:
- Circumferential Path Length: The physical circumference of the 61°S latitude circle ($2\pi R_S \cos(61^\circ) \approx 183,000\text{ km}$) is far larger than the 78.5°N circle ($2\pi R_S \cos(78.5^\circ) \approx 75,000\text{ km}$).
- Rossby Deformation Radius ($L_D$): The internal Rossby radius of deformation governs the natural horizontal wavelength of stable perturbations:
$$L_D = \frac{NH}{f}$$
Where $N$ is the Brunt-Väisälä buoyancy frequency. At 61°S, the local Coriolis parameter $f$ is smaller than at 78.5°N, altering $L_D$ and allowing a higher number of wave crests and troughs to fit stably along the jet circumference.
- Trapped Meander Resonance: As demonstrated in laboratory rotating-tank experiments, a fast, localized jet bordered by counter-rotating shears naturally folds into regular polygonal geometries. When the ratio of jet width to perimeter length matches the resonant frequency of the perturbation, the undulating wave locks into a geometric pattern.
Cross-Planetary Meteorological Comparisons
Geometric wave formations and regular vortex patterns are not unique to Saturn, but the ringed planet remains the only world known to produce closed, linear polygonal jet streams.
===================================================================================
             PLANETARY VORTEX AND POLYGON METEOROLOGY MATRIX
===================================================================================
Planet     Feature Location     Morphology                Physical Mechanism
-----------------------------------------------------------------------------------
Saturn     North Pole (78.5°N)  6-Sided Hexagon           Stationary Rossby wave;
                                                          Sheared eastward jet

Saturn     South Pole (61°S)    10-Sided Decagon          Evolving Rossby wave;
                                                          Anticyclone-triggered shear

Jupiter    North Pole (88°N)    Central cyclone +         Vortex crystal packing;
                                8 peripheral cyclones     Mutual repulsion dynamics

Jupiter    South Pole (88°S)    Central cyclone +         Vortex crystal packing;
                                5-6 peripheral cyclones   Geostrophic equilibrium

Earth      Polar Jet Stream     Undulating meanders       Transient Rossby waves;
           (45°–65°N/S)         (Wavenumbers 3 to 6)      Topographic/thermal forcing
===================================================================================
Jupiter's Polar Vortex Crystals vs. Saturn's Jet Polygons
NASA’s Juno spacecraft discovered that Jupiter’s poles are dominated by geometric clusters of discrete cyclones: an octagon of eight storms surrounding a central cyclone in the north, and a pentagon/hexagon of storms in the south.
However, Jupiter’s polygons are "vortex crystals"—individual, spinning circular cyclones that pack into regular geometric arrays due to mutual repulsive and geostrophic forces. Saturn’s formations are fundamentally different: they are single continuous jet streams moving along straight, polygonal trajectories.
          JUPITER: VORTEX CRYSTAL                 SATURN: POLYGONAL JET
              (Discrete Storms)                   (Continuous Jet Wave)

                 (O)     (O)                             /\
              (O)   \(O)/   (O)                         /  \
                 \   |   /                             /    \
                  --(O)--                             |  ()  |
                 /   |   \                             \    /
              (O)   /(O)\   (O)                         \  /
                 (O)     (O)                             \/
Earth's Polar Vortex Analogy
Earth's atmosphere frequently generates planetary Rossby waves within the polar and subtropical jet streams, typically displaying wavenumbers between $m=3$ and $m=6$. These waves govern mid-latitude weather, driving cold polar outbreaks and heat domes.
However, because Earth possesses continents, mountain ranges, and land-sea thermal contrasts, terrestrial Rossby waves are constantly disrupted by surface topography. Saturn has no solid surface. Its atmosphere acts as a clean fluid dynamic system, allowing sheared waves to maintain regular geometric shapes over planetary scales.
Short-Term and Long-Term Consequences
The confirmation of the southern decagon triggers immediate operational shifts in telescope scheduling, alongside major revisions to multi-decade planetary exploration models.
┌─────────────────────────────────────────────────────────────────────────────┐
│                          PROJECTED TIMELINE & IMPACTS                       │
├─────────────────────────────────────────────────────────────────────────────┤
│ 2026–2027: SHORT-TERM                                                       │
│ • Coordinated Hubble OPAL and JWST NIRCam/MIRI spectral campaigns.         │
│ • Numerical modeling of the 32-day vertex oscillation cycle.                │
│ • Global amateur monitoring tracking the 55°S trigger anticyclone.          │
│                                                                             │
│ 2028–2032: MEDIUM-TERM                                                      │
│ • Tracking decagon stability as Saturn approaches southern summer solstice. │
│ • Assessing whether m=10 coalesces into m=8 or decays into circular flow.   │
│ • Testing barotropic instability algorithms in exoplanet GCMs.              │
│                                                                             │
│ 2033–2045: LONG-TERM                                                        │
│ • Incorporating polar jet sounders into proposed Saturn probe architectures.│
│ • Revising interior dynamo and convective core coupling models.             │
│ • Applying unified polygon fluid models to ice giant flagship data.         │
└─────────────────────────────────────────────────────────────────────────────┘
Short-Term Consequences (1–3 Years)
- Targeted JWST Infrared Mapping: While Hubble provides visible and near-ultraviolet mapping, the James Webb Space Telescope’s NIRCam and MIRI instruments will measure the deeper thermal emission and phosphine chemistry of the Saturn south pole storm. This will verify whether the decagon’s vertical column extends into the deep ammonia-water cloud base around 3 to 10 bars of pressure.
- Decay or Stabilization Monitoring: Scientists will monitor whether the decagon is a transient feature destined to dissolve within a few Earth years, or if it will undergo non-linear self-organization to lock into a multi-decade feature like the northern hexagon.
- Vertex Oscillation Tracking: Researchers will track the 32-day radial oscillation of the ten vertices to determine if the pattern matches predicted shear instabilities driven by the 55°S anticyclonic vortex.
Long-Term Consequences (5–20 Years)
- Redesigning Outer Planet Mission Architectures: NASA’s Outer Planets Assessment Group (OPAG) and ESA mission planners are designing flagship mission proposals for the 2030s and 2040s, including Uranus and Neptune orbiters. The discovery of evolving polar decagons demonstrates that single snapshot flybys cannot capture outer-planet atmospheric dynamics. Mission concepts will prioritize high-inclination orbits and long-duration atmospheric surveillance packages.
- Refining Exoplanetary Characterization: Direct-imaging exoplanet missions, such as the Habitable Worlds Observatory (HWO) and extremely large ground telescopes (ELTs), will extract rotational period and cloud patterns from unresolved light curves. Understanding that giant planets naturally form multi-wavenumber geometric waves provides a physical framework for interpreting periodic brightness variations on distant gas giants and brown dwarfs.
- Advancing General Fluid Dynamics: Replicating the $m=10$ instability in laboratory fluid dynamics and supercomputer simulations will refine models of turbulence, zonal jet formation, and geostrophic self-organization across all rotating fluid bodies—including Earth's oceans and stratosphere.
Unresolved Questions and Future Milestones
Despite the detailed initial characterization of the southern decagon, fundamental questions remain regarding the structure's origin, lifetime, and energy source.
===================================================================================
                 CRITICAL RESEARCH QUESTIONS & UPCOMING MILESTONES
===================================================================================
Unresolved Question               Observational Test          Target Milestone
-----------------------------------------------------------------------------------
How deep does the decagon's       JWST MIRI deep thermal      Cycle 4/5 JWST
vorticity column penetrate?       sounding (5–20 μm)          Target-of-Opportunity (2027)

Will the m=10 geometry remain     Hubble OPAL annual high-    Hubble OPAL 2026–2028
stable or merge into fewer sides? resolution global imaging   Monitoring Cycles

Did the 55°S vortex initiate      High-speed wind field       Hydrodynamic supercomputer
or simply amplify the wave?       vector extraction           simulations (2026–2027)

Does the southern decagon change  Multi-spectral tracking     Saturn Southern Solstice
color across solar seasons?       from blue to methane bands  Approaching in 2032
===================================================================================- Depth and Rooting: Does the decagon extend thousands of kilometers down to where hydrogen transitions into a metallic, electrically conducting fluid, or is it confined to the outer weather layer?
- Seasonal Color Shifts: Saturn’s northern hexagon famously altered its optical color from a deep blue to a golden ochre between 2012 and 2017 as sunlight drove photochemical haze production during northern summer. Observers will watch closely to see if the southern decagon undergoes an identical photochemical cycle as southern summer approaches.
- Wavenumber Transitions: In laboratory fluids, decagons ($m=10$) are often intermediate states that eventually coalesce through vortex mergers into lower, more stable geometric modes ($m=8$, $m=6$, or $m=4$). Continuous monitoring will establish whether the southern feature remains a decagon or undergoes a structural transition over the next decade.
The discovery confirms that Saturn’s atmosphere is not a static, well-understood system, but an active, dynamic laboratory for large-scale fluid mechanics. By tracking the birth and evolution of this ten-sided storm, astronomers have moved from cataloging static planetary oddities to directly observing the physics of atmospheric pattern formation across the solar system.
Reference:
- https://www.techexplorist.com/hubble-spots-strange-new-shape-saturns-south-pole/104116/
- https://science.nasa.gov/missions/hubble/nasas-hubble-tracks-new-decagon-encircling-saturns-south-pole/
- https://gizmodo.com/a-giant-hexagon-has-been-spinning-at-saturns-north-pole-for-decades-now-scientists-found-its-twin-2000806285
- https://www.ssl.berkeley.edu/decagon-wave-emerges-near-saturns-south-pole/
- https://www.sciencealert.com/astronomers-spot-an-uncannily-geometric-10-sided-structure-in-saturns-atmosphere
- https://www.space.com/astronomy/saturn/astronomers-discover-mysterious-10-sided-cloud-structure-at-saturns-south-pole
- https://apnews.com/article/saturn-nasa-hubble-decagon-1fd4a0a90badacb6e4e18ac019ac6ead
- https://www.sciencenews.org/article/hubble-decagon-saturn-south-pole
- https://www.skyatnightmagazine.com/news/saturn-decagon-feature-south-pole
- https://www.sciencedaily.com/releases/2026/09/260903064229.htm
- https://economictimes.indiatimes.com/news/international/global-trends/astronomers-finally-spot-what-saturns-south-pole-was-hiding-a-massive-10-sided-atmospheric-wave-that-scientists-still-cant-explain/articleshow/133741318.cms?from=mdr
- https://www.smithsonianmag.com/smart-news/a-mysterious-decagon-unexpectedly-appeared-around-saturns-south-pole-the-ten-sided-shape-seems-to-be-a-wave-in-the-atmosphere-180989449/