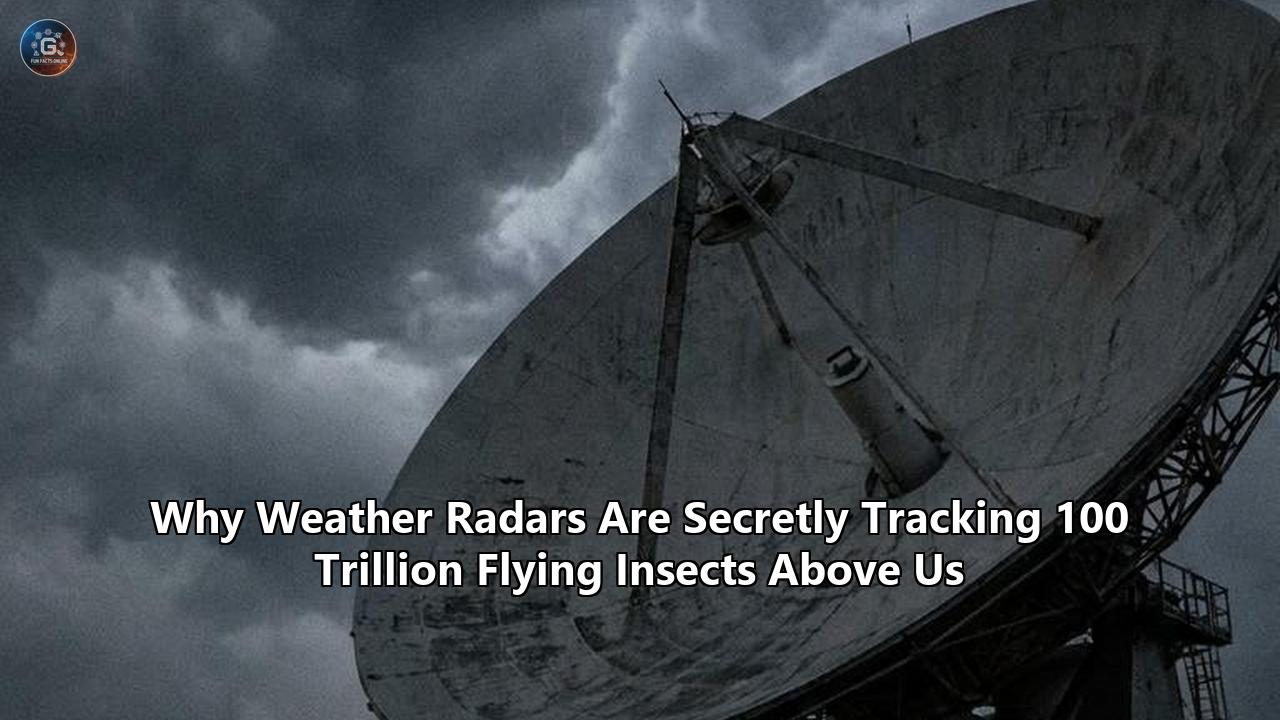
On a typical summer day, a massive, silent migration occurs directly above our heads, invisible to the naked eye. In the skies over the contiguous United States, approximately 100 trillion insects are aloft at any given moment, representing millions of tons of biological matter in motion. For decades, this massive aerial highway went largely unmonitored. Ecologists lacked the tools to count trillions of tiny, flying organisms across millions of square kilometers, while meteorologists dismissed these swarms as annoying noise—"biological clutter" that contaminated their weather models.
Two studies published in late 2025 have upended this dynamic. Writing in the peer-reviewed journal Global Change Biology, international research teams demonstrated that existing national weather radar networks can be repurposed to map, count, and track flying insects at unprecedented scales.
First, a team led by Dr. Elske Karolien Tielens of the Swiss Federal Institute for Forest, Snow and Landscape Research (WSL), along with colleagues Dr. Jeff Kelly of the University of Oklahoma and Dr. Phil Stepanian of the MIT Lincoln Laboratory, analyzed ten years of historical data from 140 radars across the United States. They revealed a baseline of 100 trillion insects filling the summer air.
Simultaneously, a UK-focused study published by Dr. Mansi Mungee of Azim Premji University (formerly of the University of Leeds) and her colleagues from the BioDAR project analyzed data from 2014 to 2021 over 35,000 square kilometers of the United Kingdom. Their work estimated that an average of 11.2 trillion insects fly over the UK during the day, dropping to 5.02 trillion at night.
These publications are more than just impressive mathematical exercises. They represent a fundamental shift in how we monitor global biodiversity. By transforming public weather radar networks into a planetary ecological observatory, scientists have proven the viability of weather radar insect tracking as a primary tool for studying the Earth's "aerosphere".
This case study analyzes how these researchers unlocked these massive datasets, the physical principles that make this tracking possible, and the lessons we can extract about repurposing public industrial infrastructure to address the global biodiversity crisis.
The Physics of Scattering: How Weather Radar Insect Tracking Decodes the Sky
To understand how weather radar insect tracking works, one must first look at how meteorological radar systems interact with the atmosphere.
For decades, the dominant weather surveillance radar in the United States has been NEXRAD (Next Generation Weather Radar), a network of 160 high-resolution S-band Doppler radars operated by the National Oceanic and Atmospheric Administration (NOAA). Similar systems, operating on both S-band (10 cm wavelengths) and C-band (5 cm wavelengths), protect airspace and generate weather forecasts across Europe and the UK.
These radars operate by sending out pulses of electromagnetic energy and measuring the backscatter—the energy that bounces off objects in the air and returns to the radar dish.
Historically, these systems emitted only horizontally polarized pulses, measuring the horizontal dimensions of whatever was in the sky. In the early 2010s, a major upgrade introduced "dual-polarization" technology to the NEXRAD network and European radar arrays. Dual-polarization radars transmit and receive both horizontally and vertically polarized radio waves. This allows the radar to measure not just the size of an object, but its horizontal and vertical cross-sections simultaneously.
Horizontal Pulse  --------->  [=== Insect ===]  ---------> Strong Return
Vertical Pulse    --------->  [=== Insect ===]  ---------> Weak Return
Ratio (Horizontal / Vertical) = High Differential Reflectivity (ZDR)
This dual-polarization capability is the foundation of modern weather radar insect tracking. It relies on three primary variables to distinguish a flying gnat from a raindrop or a swallow:
1. Differential Reflectivity ($Z_{DR}$)
Differential reflectivity is the logarithmic ratio of the returned power from the horizontal pulse to that of the vertical pulse, measured in decibels (dB).
- Raindrops: Because falling raindrops are aerodynamic, they flatten out slightly into oblate spheroids as they fall, yielding a mildly positive $Z_{DR}$ (generally between 0 and 1.5 dB). Small cloud droplets or hailstones are roughly spherical and return a $Z_{DR}$ of approximately 0 dB.
- Insects: Flying insects are highly asymmetric. They are elongated, cylindrical organisms that typically fly horizontally. When a radar beam hits a cloud of horizontally aligned insects, the horizontal return is far stronger than the vertical return, resulting in highly positive $Z_{DR}$ values, often exceeding 3.5 to 5 dB.
2. Copolar Correlation Coefficient ($\rho_{HV}$ or RHOHV)
This metric measures the uniformity of the shapes and orientations of the scatterers within a given volume of air.
- Precipitation: In a uniform downpour or snowstorm, the falling particles are highly similar in shape and behavior, yielding a $\rho_{HV}$ value very close to 1.0 (typically 0.97 to 0.99).
- Biological Targets: A swarm of insects or a flock of birds is highly chaotic, with varying body sizes, wing-flapping cycles, and flight orientations. This structural diversity causes the horizontal and vertical returns to fall out of sync, driving the $\rho_{HV}$ down significantly, often below 0.90 or 0.85.
3. Radial Velocity and Spectrum Width
By measuring the Doppler shift of the returned signal, radars calculate how fast objects are moving toward or away from the radar dish. Insects have low body masses and are largely carried by the prevailing winds. By comparing the movement speed of the targets against local wind profiles—often collected via NOAA's rapid-refresh meteorological models—algorithms can verify if a target is drifting with the wind (like insects) or flying actively against it (like migrating birds or bats).
Reversing the Filter
For meteorological agencies, these biological signals are noise. To generate clean rain maps, weather processing software uses automated algorithms to identify areas with high $Z_{DR}$, low $\rho_{HV}$, and wind-drift velocities, classifying them as "biological clutter" and filtering them out of public weather maps.
The breakthrough achieved by Tielens, Mungee, and their respective research teams was to flip this process. Instead of discarding the clutter, they discarded the weather.
By analyzing the archived raw data before the meteorological filters were applied, the researchers designed algorithms that stripped away rain, snow, hail, and avian migrations. What remained was a clean, high-resolution dataset containing only the radio echoes of trillions of flying arthropods.
Repurposing Dark Data: Lessons from the Aeroecology Case Study
The success of these studies offers a valuable lesson in modern environmental science: the concept of structural piggybacking or harvesting "dark data."
Ecologists have long warned of a looming "insect apocalypse"—a widespread decline in insect populations driven by habitat destruction, pesticide use, and climate change. However, proving the extent of this decline has been notoriously difficult. Traditional entomological monitoring relies on localized, manual methods:
- Malaise Traps: Tent-like structures that intercept flying insects, requiring researchers to manually collect, preserve, and identify specimens.
- Sticky Traps and Suction Traps: Highly localized devices that provide excellent species-level detail but are labor-intensive and cover only a few square meters.
- Citizen Science Initiatives: Community-driven efforts like butterfly counts, which are invaluable but highly subjective, geographically biased toward populated areas, and seasonally inconsistent.
These traditional methods produce high taxonomic resolution (identifying the exact species of beetle or bee) but suffer from extremely low spatial and temporal resolution. They are isolated dots on a map. Trying to understand continental insect populations using malaise traps is like trying to map the flow of the global economy by looking at the cash register of a single corner store.
+-------------------------------------------------------------------------+
|                  METHODOLOGICAL TRADE-OFF IN ECOLOGY                     |
|                                                                         |
|  HIGH                                                                   |
|   ▲                                                                     |
|   │  [Traditional Sampling]                                             |
|   │  - Suction traps, sticky cards, manual netting                      |
|   │  - Pros: High taxonomic resolution (exact species identification)  |
| T │  - Cons: Extremely localized, high labor cost, poor scale           |
| A │                                                                     |
| X │                                                                     |
| O │                                                                     |
| N │                                              [Radar Aeroecology]    |
| O │                                              - Weather radar grids  |
| M │                                              - Pros: Continental    |
| I │                                                scale, continuous    |
| C │                                                historical archive   |
|   │                                              - Cons: Low taxonomic  |
|   │                                                precision            |
|   └───────────────────────────────────────────────────────────────────► |
|  LOW                           SPATIAL / TEMPORAL SCALE            HIGH |
+-------------------------------------------------------------------------+
This is where the case of weather radar insect tracking provides a structural blueprint. Rather than building a multi-billion-dollar global insect monitoring network from scratch—an impossibility given public funding constraints—scientists successfully piggybacked on an existing, fully funded, state-of-the-art public safety network.
This approach reveals three core principles for repurposing industrial data for ecological monitoring:
Principle 1: Leverage Existing Continuous Infrastructure
Weather radar networks are built, maintained, and calibrated by national governments to protect human life and property from severe storms. The infrastructure is permanent, continuously active (scanning 24/7, 365 days a year), and structurally standardized. By utilizing this existing network, ecologists bypassed the massive capital expenses associated with deploying physical monitoring hardware, gaining access to a continent-spanning monitoring grid for the cost of computational processing power alone.
Principle 2: Unlock the Value of Open-Access Archives
The U.S. study was made possible because NOAA maintains open-access public archives of raw, unmanipulated NEXRAD data dating back decades. This archive acts as a scientific time machine.
If a researcher sets up a new insect trap today, they must wait ten years to collect a ten-year time series. But by utilizing NOAA’s open-access radar archive, Dr. Tielens' team was able to retroactively construct a continuous, highly standardized ten-year time series (from 2012 to 2021) across the entire United States in a fraction of the time. Open-data policies transform short-term research capabilities by turning historical operational data into retrospective baselines.
Principle 3: Bridge Disciplinary Silos
Aeroecology is a inherently interdisciplinary field. It sits at the intersection of:
- Electromagnetic Engineering and Radar Physics: To model how microwaves bounce off insect exoskeletons.
- Meteorology and Atmospheric Science: To isolate biological movements from wind, pressure gradients, and precipitation.
- Computational Biology and Machine Learning: To process petabytes of raw radar imagery, clean out clutter, and convert backscatter measurements into estimated insect densities.
- Entomology and Landscape Ecology: To interpret what these massive numbers mean for agriculture, food webs, and conservation.
By breaking down the walls between meteorology and biology, these researchers turned what was once considered operational "garbage" (biological radar clutter) into one of the most valuable ecological datasets on the planet.
The Fragmented Sky: What Radar Reveals About the Insect Apocalypse
When this radar lens was applied to the skies of the United States and the United Kingdom, the results challenged simplified narratives of a uniform, global "insect apocalypse," revealing a highly complex, fragmented reality.
The U.S. Study: A Spatial Mosaic and the Winter Warming Paradox
In their continental U.S. analysis, Dr. Tielens and her team converted raw radio echoes into real density numbers. They calculated that in a typical vertical column of air stretching two miles high, there is an average midday density of 4.3 insects per square meter. When scaled across the entire lower 48 states on a peak summer day, this translates to roughly 100 trillion individual insects flying overhead.
┌──────────────────────────────────────────────────────────┐
│  TYPICAL MIDDAY AIR COLUMN (U.S. Continental Summer)     │
├──────────────────────────────────────────────────────────┤
│                                                          │
│  ▲                                                       │
│  │                                                       │
│  │  Altitude: ~2 Miles (10,560 ft)                       │
│  │                                                       │
│  │  Average Density: 4.3 insects per square meter        │
│  │                                                       │
│  │  Total Continental Load: ~100 Trillion Insects        │
│  │                                                       │
│  ▼                                                       │
│                                                          │
└──────────────────────────────────────────────────────────┘
The ten-year time series (2012–2021) yielded a surprising finding: at the continental scale, the overall abundance of flying insects in the U.S. remained relatively stable. There was no massive, uniform downward trend. However, zooming in to the regional level revealed a stark, fragmented mosaic:
- 52% of radar sites recorded rising insect densities over the decade.
- 48% of radar sites recorded declining insect densities.
To understand what was driving this regional divergence, the researchers modeled the radar data against various environmental and climatic variables. They discovered that the single strongest statistical predictor of regional insect decline was warming winter temperatures.
This "winter warming paradox" is particularly severe at higher latitudes. Many temperate insect species depend on cold, stable winter temperatures to enter diapause—a state of suspended development akin to hibernation—which allows them to conserve energy and survive the winter months.
When winter temperatures warm up or fluctuate wildly, it disrupts this dormant state. Insects may emerge too early, exhaust their stored fat reserves before spring food sources are available, or become highly vulnerable to pathogens, parasites, and sudden late-season freezes. The radar data clearly showed that in regions where winters warmed the most over the decade, summer insect densities saw the most severe declines.
The UK Study: The Alarming Collapse of the Night Swarm
In the United Kingdom, Dr. Mansi Mungee’s team utilized the UK's dual-polarization radar network to analyze a 500-to-700-meter height band above the ground. This band is high enough to avoid ground clutter but low enough to capture active insect migration and transport.
The UK findings revealed a highly concerning ecological divergence between day-flying and night-flying insects:
- Day-Flying Insects (Diurnal): Daytime insect numbers (estimated at 11.2 trillion) remained relatively stable over the eight-year study period (2014–2021), showing high year-to-year variation but no net decline.
- Night-Flying Insects (Nocturnal): Nighttime insect numbers (estimated at 5.02 trillion) showed a widespread, significant decline over the same period, particularly in the northern reaches of the country.
+-----------------------------------------------------------------+
|               UK AERIAL INSECT DIVERGENCE (2014-2021)           |
+─────────────────────────────────┬───────────────────────────────+
│   DAY-FLYING (DIURNAL)          │   NIGHT-FLYING (NOCTURNAL)    │
│   ~11.2 Trillion Insects        │   ~5.02 Trillion Insects      │
├─────────────────────────────────┼───────────────────────────────┤
│                                 │                               │
│  Trend: Stable                  │  Trend: Declining             │
│  (High annual fluctuation)      │  (Severe in northern UK)      │
│                                 │                               │
│  Drivers:                       │  Drivers:                     │
│  - Tolerant to daylight         │  - High light pollution       │
│  - Stable in woodlands          │  - Agricultural intensity     │
│                                 │                               │
+─────────────────────────────────┴───────────────────────────────+
The UK study identified Artificial Light at Night (ALAN) as a primary culprit behind this nocturnal decline.
Streetlights, security lights, and industrial glow act as giant sensory traps for nocturnal insects like moths, lacewings, and beetles. Light pollution disrupts their navigation, exhausts them as they fly in endless loops around light sources, and makes them easy prey for urban predators like bats and spiders.
By cross-referencing radar data with satellite maps of light pollution, the researchers confirmed that areas with the highest levels of artificial night lighting consistently exhibited the lowest densities of nighttime airborne insects.
Furthermore, both studies highlighted the profound impact of land-use patterns on insect density. High insect concentrations were consistently detected over landscapes dominated by woodlands, natural grasslands, and surprisingly, even semi-vegetated urban areas. Conversely, intensively farmed arable land—often considered "green" by human standards—showed up on radar as virtual biological deserts, stripped of the diverse habitats and wild floral resources that support robust aerial insect life.
Resolving the Blind Spots: The Limitations of Radar Entomography
While weather radar insect tracking is a powerful advancement in macro-ecology, it is not a perfect solution. Like any remote sensing technology, it has distinct spatial, physical, and taxonomic limits that require careful calibration.
Understanding these limitations is essential for correctly interpreting radar data and successfully integrating it with traditional field biology:
1. The Species Identification Problem
The most significant limitation of radar entomology is its lack of taxonomic resolution. A radar beam cannot distinguish between:
- A swarm of beneficial honeybees pollinating crops.
- A devastating swarm of crop-eating fall armyworm moths.
- A cloud of biting mosquitoes carrying vector-borne diseases.
To the radar, these are all simply backscatter echoes. While dual-polarization variables like $Z_{DR}$ and specific differential phase ($\phi_{DP}$) can help estimate the average body length and general shape profile of a swarm (distinguishing, for instance, a 5mm beetle from a 25mm moth), they cannot identify the exact species.
As Dr. Tielens noted, a stable or rising radar signal could mask a highly concerning ecological shift—such as the extinction of sensitive, specialized pollinators being replaced by an explosion of a few highly resilient, invasive pest species.
2. The Radar Blind Zone and Elevation Gap
Radars do not scan the ground; they scan the sky at a slight upward angle (typically starting at 0.5 degrees relative to the horizon) to avoid hitting buildings, trees, and hills. This design creates two distinct blind spots for ecologists:
- The Ground Boundary Layer: The vast majority of insect life lives, feeds, and reproduces in the immediate boundary layer—from ground level up to about 100 meters. Weather radars miss almost all of this activity because their beams pass high above it, particularly at greater distances from the radar station.
- The Cone of Silence: Directly above the radar station, there is a vertical gap where the radar dish cannot tilt, meaning flights directly overhead are not recorded.
To avoid these issues, the UK team had to restrict their analysis to a narrow slice of air between 500 and 700 meters above the ground, where the radar beam is clean and free of ground clutter. However, this means that insects flying closer to the ground go completely unrecorded.
3. Calibration and Echo Conversion
Converting a measure of raw backscattered energy (reflectivity in decibels of $Z$) into a precise count of individual insects is an incredibly complex biophysical modeling challenge.
A radar return of a given intensity could represent a small number of large insects (like locusts) or a massive number of tiny insects (like midges). Researchers must use complex electromagnetic models of "radar cross-sections" ($RCS$) to estimate biomass and abundance, but these models are highly sensitive to assumptions about insect water content, shape, and orientation.
                     ┌─────────────────────────────┐
                     │    Raw Radar Reflectivity   │
                     └──────────────┬──────────────┘
                                    │
                  ┌─────────────────┴─────────────────┐
                  ▼                                   ▼
     [ Scenario A: High Density ]        [ Scenario B: Low Density ]
     - Trillions of tiny midges          - Billions of large moths
     - Low individual RCS                - High individual RCS
     - Equal total backscatter           - Equal total backscatter
                  ▲                                   ▲
                  └─────────────────┬─────────────────┘
                                    │
                     ┌──────────────┴──────────────┐
                     │  Requires Ground Validation  │
                     │  To Correctly Differentiate │
                     └─────────────────────────────┘
The Solution: Hybrid Monitoring Networks
To overcome these blind spots, modern ecological programs are moving toward hybrid monitoring networks that pair the immense scale of weather radars with the high taxonomic precision of ground-based sampling:
- Automated Suction Traps: Networks like the Rothamsted Insect Survey in the UK use vertically pointing suction traps to continuously capture and count insects at ground level. By comparing physical catches with radar sweeps overhead, scientists can "ground-truth" the radar signals, identifying exactly which species are driving the changes in biomass detected in the sky.
- Dedicated Entomological Radars: Unlike weather radars, specialized entomological radars point vertically and operate at much higher frequencies (such as X-band or Ka-band). These systems can track individual insects as they fly overhead, recording their exact size, shape, wing-beat frequency, and flight heading, which helps catalog the specific groups of insects aloft.
- Machine Learning and Environmental DNA (eDNA): Researchers are beginning to integrate automated camera traps and high-throughput eDNA sequencing of airborne dust into radar monitoring stations. This allows them to pair regional biomass trends with near-real-time genetic profiles of the local insect community.
Ultimately, while ground-based entomological traps provide local taxonomic depth, weather radar insect tracking provides the structural, macro-scale canopy that traditional methods lack.
Operationalizing the Aerosphere: The Future of Aerial Commons Management
The realization that our skies are filled with trillions of flying insects—and that we have a built-in national infrastructure to track them—has profound implications for how we manage agricultural, urban, and natural landscapes in the coming decades.
As we look toward the late 2020s, weather radar insect tracking is transitioning from an academic research project into an active, operational tool for public policy, conservation, and resource management.
┌────────────────────────────────────────────────────────────────────────┐
│               OPERATIONAL APPLICATIONS OF RADAR AEROECOLOGY             │
├────────────────────────────────────────────────────────────────────────┤
│                                                                        │
│  [Agriculture]  ────────► Early-Warning Pest Tracking                  │
│                           - Minimizes preemptive pesticide spraying    │
│                           - Tracks nocturnal pest migrations           │
│                                                                        │
│  [Conservation] ────────► Dynamic Habitat Protection                   │
│                           - Directs funding to forest/grassland zones  │
│                           - Evaluates efficacy of rewilding programs   │
│                                                                        │
│  [Urban Design] ────────► Smart Lighting & Collision Mitigation        │
│                           - Triggers temporary dimming in cities       │
│                           - Integrates with bird/insect safety codes   │
│                                                                        │
└────────────────────────────────────────────────────────────────────────┘
Several key sectors stand to be transformed by the integration of weather radar data into daily operations:
1. Precision Agriculture and Pest Mitigation
Many of the world's most destructive agricultural pests are highly migratory, nocturnal insects.
For example, the corn earworm moth (Helicoverpa zea) and the fall armyworm (Spodoptera frugiperda) cause billions of dollars in crop damage annually across North and South America. Because these pests migrate at night, farmers are often caught unprepared. They must rely on historical patterns or make educated guesses, often resulting in the preemptive, widespread spraying of chemical pesticides.
By integrating weather radar insect tracking into regional agricultural extension services, scientists can build real-time pest early-warning systems.
When a radar detects a massive, nocturnal wave of insects rising from breeding grounds and drifting toward agricultural belts, farmers can be alerted immediately. This allows them to apply targeted, biological pest control measures exactly when and where they are needed, drastically reducing both crop losses and unnecessary pesticide applications.
2. Radar-Informed Urban Planning and Smart Cities
The discovery that light pollution is a major driver of the collapse of nocturnal insect populations provides a clear pathway for urban designers.
Using weather radar networks, cities can identify specific "hotspots" where nighttime insect attraction is most severe. Municipalities can use this data to implement "smart lighting" strategies, such as:
- Upgrading streetlights to narrow-spectrum, amber LED bulbs, which are far less attractive to nocturnal insects than harsh white or blue lights.
- Utilizing motion-activated public lighting in industrial zones, ensuring areas are illuminated only when humans are present.
- Establishing seasonal "lights-out" initiatives during peak migration periods, dimming commercial high-rises and non-essential municipal lights when radar arrays detect major insect movements overhead.
3. Measuring the Success of Rewilding Programs
As governments and conservation groups invest billions of dollars in rewilding programs, forest restoration, and urban green corridors, they require reliable metrics to evaluate their return on investment.
Because weather radar insect tracking is highly sensitive to habitat type, it provides an automated, objective, and standardized way to measure ecosystem recovery over time.
If a region successfully restores a large wetland or transitions intensively farmed land back into natural woodland, researchers should see a corresponding, long-term increase in the aerial insect biomass recorded by nearby radar stations. This provides a direct, data-driven feedback loop to verify if conservation policies are working.
4. Aeroecology as a Global Policy Framework
Historically, environmental protection laws have focused almost exclusively on the terrestrial and aquatic realms. We have protected forests, rivers, and oceans, but we have largely ignored the air as a biological habitat.
The concept of the "aerosphere" as an active, integrated ecosystem is finally gaining legal and regulatory traction. Trillions of insects, birds, and bats use the lower atmosphere to forage, migrate, and disperse, making the air a shared global commons that requires proactive conservation.
As global climate change continues to alter wind patterns, temperatures, and seasonal cues, the aerial pathways that connect distant ecosystems will face growing disruption.
The pioneering studies of late 2025 have shown us that we do not need to fly blind into this changing landscape. The very tools we built to watch the weather are already watching the vast, silent swarms of life that sustain our planet, giving us an unprecedented opportunity to protect the invisible ecosystems humming directly above us.
Key Takeaways from the Aeroecology Case Studies
| Metric / Aspect | United States Continental Study (Tielens et al. 2025) | United Kingdom Regional Study (Mungee et al. 2025) |
|---|---|---|
| Data Scope | 140 NOAA NEXRAD Radar Sites (Contiguous US) | 35,000 Square Kilometers (United Kingdom) |
| Temporal Span | 10-Year Time Series (2012–2021) | 8-Year Time Series (2014–2021) |
| Evaluated Altitudes | Up to 2-Mile-High Column | 500 to 700 Meters above ground |
| Total Estimated Load | ~100 Trillion Insects (Summer Day Baseline) | ~11.2 Trillion (Day) / ~5.02 Trillion (Night) |
| Primary Findings | Continental baseline is stable, but with a highly regional mosaic of decline and growth | Alarming decline in nocturnal flyers, while day-flying populations remain stable |
| Key Environmental Drivers | Winter Warming: High-latitude regions with warming winters saw severe local declines | Light Pollution & Arable Land: High artificial light and intensive farming drove nocturnal declines |
Reference:
- https://www.terradaily.com/reports/Insect_radar_survey_finds_vast_summer_air_traffic_above_United_States_999.html
- https://environment.leeds.ac.uk/see/news/article/463/using-weather-radar-to-monitor-insects
- https://journals.ametsoc.org/view/journals/atot/2/1/1520-0426_1985_002_0049_ioudpr_2_0_co_2.pdf
- https://biologicalsciences.leeds.ac.uk/biological-sciences/news/article/556/the-flight-of-insects-and-why-weather-radar-may-hold-the-clues
- https://www.snexplores.org/article/flying-insect-abundance-air
- https://ncas.ac.uk/weather-radar-reveal-hidden-patterns-in-uk-insect-populations/
- https://www.leeds.ac.uk/news-environment/news/article/5869/trillions-of-insects-fly-above-us-weather-radar-reveals-alarming-declines
- https://pmc.ncbi.nlm.nih.gov/articles/PMC12555869/
- https://www.earth.com/news/radar-technology-reveals-100-trillion-insects-flying-over-the-us/
- https://royalsocietypublishing.org/rstb/article/379/1904/20230113/42784/Monitoring-aerial-insect-biodiversity-a-radar
- https://www.biorxiv.org/content/10.1101/2024.07.17.601450v1.full-text
- https://repository.library.noaa.gov/view/noaa/32181/noaa_32181_DS1.pdf
- https://www.rainviewer.com/blog/pro-radar-differential-reflectivity-correlation-coefficient.html
- https://www.meteor.iastate.edu/classes/mt407/powerpoint/dualpol.pdf
- https://www.researchgate.net/publication/403636793_Dual_Wavelength_CSU-CHILL_Radar_Observations_of_Insects_and_Birds
- https://www.mdpi.com/2072-4292/18/5/727
- https://agresearchmag.ars.usda.gov/2014/sep/weather
- https://www.earth.com/news/night-skies-are-going-quiet-radar-reveals-steep-insect-declines/
- https://pubmed.ncbi.nlm.nih.gov/41251043/
- https://nautil.us/how-many-insects-fill-the-air-on-a-typical-summer-day-in-the-us-1253702
- https://www.earth.com/news/radar-technology-reveals-100-trillion-insects-flying-over-the-us/
- https://etheses.whiterose.ac.uk/id/eprint/37783/1/Thesis_final.pdf