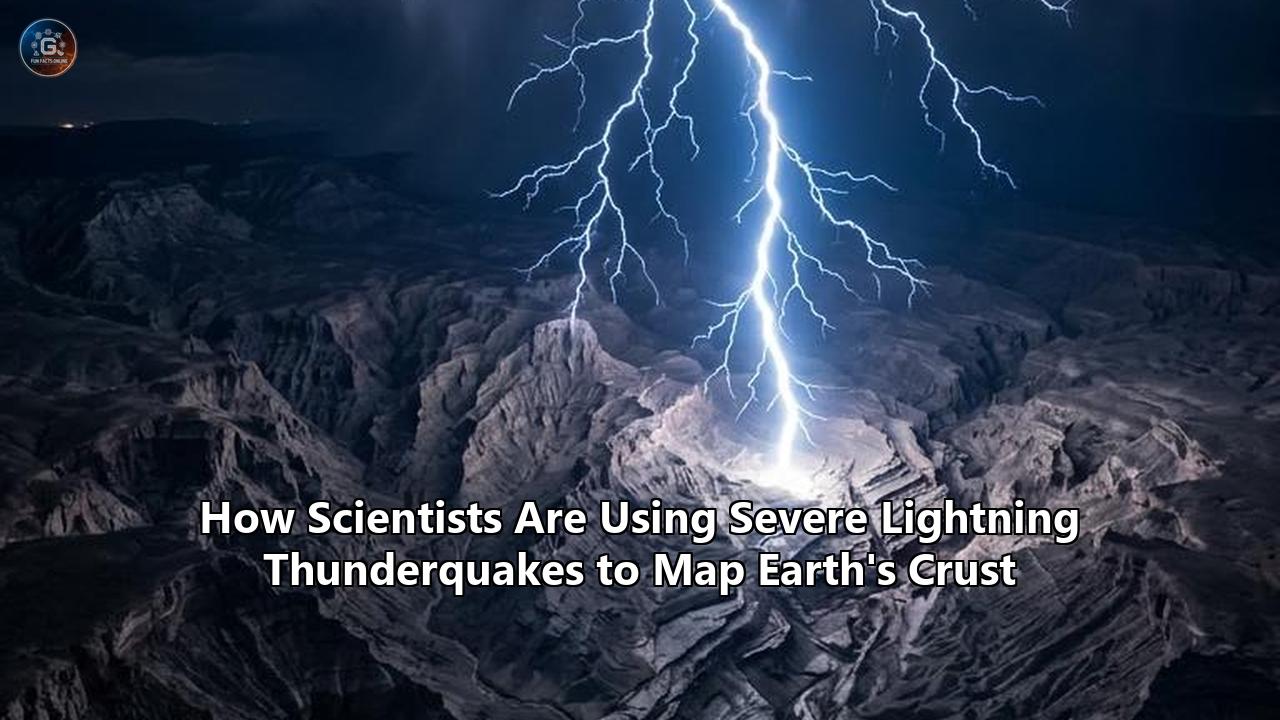
On August 21, 2026, an interdisciplinary team of geophysicists at Pennsylvania State University published findings in Science Advances confirming the successful execution of high-resolution subsurface tomography driven entirely by atmospheric lightning strikes. By recording the seismic reverberations generated when thunder slams into the ground—a phenomenon termed a "thunderquake"—researchers mapped the upper 100 meters of the planet's subsurface with extraordinary clarity.
Rather than deploying fleets of multi-ton vibroseis trucks or detonating buried dynamite charges, the team tapped into 4.2 kilometers of pre-existing, buried fiber-optic telecommunications cables beneath the university's University Park campus in State College, Pennsylvania. Over two and a half years, the array captured 458 confirmed thunderquakes validated against lightning strike data from the National Lightning Detection Network (NLDN). The resulting data revealed four previously undetected structural weak zones and incipient sinkhole hazards in the region's complex karst bedrock.
This demonstration provides a definitive framework for using severe atmospheric electricity as a repeatable, cost-free seismic source. As a case study, the Penn State experiment illustrates a fundamental shift in environmental geophysics: the synthesis of atmospheric physics, urban telecommunications infrastructure, and computational seismology to achieve continuous, non-invasive imaging of shallow geological strata.
Anatomy of a Thunderquake: The Mechanics of Air-to-Ground Energy Conversion
To understand how scientists transformed a thunderstorm into a geological probe, one must examine the physics governing atmospheric-to-seismic coupling. When a cloud-to-ground lightning channel forms, electric currents exceeding tens of thousands of amperes superheat the surrounding air to temperatures above 30,000 Kelvin in mere microseconds. This instantaneous thermal expansion generates a supersonic cylindrical shockwave that expands radially outward before rapidly decaying into high-amplitude linear acoustic waves—the acoustic signature recognized as thunder.
+-------------------------------------------------------------------------+
|                  LIGHTNING CHANNEL (T > 30,000 K)                       |
|               Supersonic Shockwave Expansion (P > 10 atm)               |
+-------------------------------------------------------------------------+
                                    │
                                    ▼
+-------------------------------------------------------------------------+
|                     ATMOSPHERIC ACOUSTIC WAVE                           |
|                      (V_air ≈ 340 m/s; 1–150 Hz)                        |
+-------------------------------------------------------------------------+
                                    │
                                    ▼  [Air-to-Ground Impedance Boundary]
+-------------------------------------------------------------------------+
|                           GROUND COUPLING                               |
|        Direct Acoustic Arrival  +  Diffracted Air-Coupled Rayleigh      |
|                        and Love Surface Waves                           |
+-------------------------------------------------------------------------+
                                    │
                                    ▼
+-------------------------------------------------------------------------+
|              DISTRIBUTED ACOUSTIC SENSING (DAS) ARRAY                   |
|       Sub-meter Strain Measurements via Rayleigh Backscattering         |
+-------------------------------------------------------------------------+
As these acoustic pressure waves strike the Earth's surface, they encounter a profound mechanical impedance mismatch. Acoustic impedance ($Z$) is the product of medium density ($\rho$) and wave velocity ($v$). In ambient atmospheric air, $Z_{\text{air}} \approx 400\ \text{Pa}\cdot\text{s/m}$, whereas consolidated near-surface rock exhibits $Z_{\text{rock}} > 10^6\ \text{Pa}\cdot\text{s/m}$. While the vast majority of acoustic energy reflects back into the sky, a measurable fraction transfers into the solid Earth via dynamic mechanical stress at the boundary.
This mechanical boundary stress excites two primary categories of elastic waves within the solid crust:
- Direct Air-Coupled Compressive Waves ($P$-waves): Highly localized, high-frequency body waves that attenuate rapidly within the first several meters of soil.
- Dispersive Surface Waves (Rayleigh and Love waves): Coherent, low-to-mid-frequency (5 to 50 Hz) interface waves that propagate laterally through the shallow rock matrix.
Historically, seismologists struggled to isolate these signals. Lightning-induced ground motion was frequently dismissed as high-frequency cultural noise or transient sensor saturation. Earlier theoretical models debated whether the measured ground motion was primarily acoustic-to-seismic mechanical coupling or an electroseismic conversion triggered by the lightning strike's intense electromagnetic field.
The Penn State investigation settled this debate through 3D numerical simulations using the spectral-element solver SPECFEM3D Cartesian. The modeling demonstrated that electroseismic conversions attenuate within centimeters due to high electrical conductivity in near-surface moisture, leaving acoustic-to-seismic surface waves as the dominant signal captured by subsurface arrays.
The acoustic energy from thunder matches the spatial resonance of the shallow crust. When the horizontal phase velocity of an incident atmospheric wave aligns with the seismic wave velocity of the uppermost regolith, an effect known as air-coupled matching occurs, continuously pumping energy into dispersive Rayleigh waves.
These wavefields carry information about the material properties of the rocks and soils through which they travel, providing the essential raw signal required for mapping earth crust structures without artificial energy sources.
Repurposing Dark Fiber: The Distributed Acoustic Sensing Engine
The linchpin of this methodology is Distributed Acoustic Sensing (DAS). Traditional seismic surveys rely on discrete geophones or broadband seismometers deployed in expensive, labor-intensive geometric grids. Deploying thousands of standalone seismometers across an active university campus, municipal center, or highway corridor is logistically difficult and cost-prohibitive.
DAS circumvents this bottleneck by converting standard telecommunications optical fiber into a continuous, dense array of strain meters.
                               LASER PULSE
                   ──────────────────────────────────>
 [Interrogator] ══════════════════════════════════════════ [Terminus]
                   <── ── ── ── ── ── ── ── ── ── ── ──
                             BACKSCATTERED LIGHT
                                      │
                   Strain from passing thunderquake wave
                   stretches/compresses fiber microscopic glass
An optoelectronic instrument known as an interrogator unit connects to one end of a dedicated fiber strand. The interrogator fires ultra-short, highly coherent pulses of laser light down the glass core at kilohertz frequencies. As the light propagates, microscopic imperfections, density fluctuations, and structural impurities inherent to the glass reflect back a minute fraction of the optical energy via elastic Rayleigh backscattering.
When an atmospheric thunderquake wave shakes the ground, the mechanical deformation strains the buried conduit, stretching and compressing the fiber by nanometers. This physical strain alters the distance between the microscopic scattering centers, causing measurable phase shifts in the backscattered light. By measuring the round-trip travel time and the optical phase interference of the returning photons, the interrogator computes the exact longitudinal strain rate at thousands of discrete intervals—known as channels—along the entire length of the cable.
| Operational Parameter | Penn State Campus DAS Setup | Conventional Geophone Array |
|---|---|---|
| Total Sensor Footprint | 4.2 km single cable path | ~50–100 discrete stations |
| Channel Spacing | 1.0 to 2.0 meters | 25 to 50 meters |
| Effective Channel Count | >2,100 continuous spatial channels | 50–100 recording channels |
| Sampling Frequency | 500 Hz to 1,000 Hz | 100 Hz to 500 Hz |
| Deployment Mechanism | Pre-existing "dark fiber" in utility conduits | Manual trenching, geophone planting, wiring |
| Installation Impact | Zero surface disruption | High logistical and environmental footprint |
"Without incredibly high-resolution sensing, it is difficult to actually piece together what is going on when the thunder hits the ground," explained lead author Nolan Roth. "With DAS, we are recording hundreds of samples every second and every few meters along the cable. This allowed us to see what was going on in that transition from atmospheric acoustic energy to solid-earth seismic propagation".
Because fiber-optic cables lie buried directly beneath pavements and lawns throughout urban corridors, they capture environmental seismic wavefields without requiring new excavation. The State College setup monitored a continuous 4.2-kilometer trajectory traversing varying surface materials, road intersections, and open green spaces, creating an ultra-dense array across a 3D subsurface volume.
From Atmospheric Discharges to Velocity Maps: The Tomographic Workflow
Translating 458 raw thunderquake signals into coherent geological images required a sophisticated multi-stage data processing pipeline. The mathematical and algorithmic workflow leveraged ambient noise cross-correlation and virtual-source interferometry to turn chaotic atmospheric claps into high-fidelity seismic velocity cross-sections.
+-------------------------------------------------------------------------+
|                  STAGE 1: Event Identification & Validation             |
|   • Continuous 2.5-yr DAS stream continuous scanning                    |
|   • Cross-referencing NLDN timestamps & peak currents (I_peak > 10 kA)  |
+-------------------------------------------------------------------------+
                                    │
                                    ▼
+-------------------------------------------------------------------------+
|                 STAGE 2: Pre-Processing & Bandpass Filtering            |
|   • Decimation & bandpass filtering (5–50 Hz)                           |
|   • Removal of urban cultural noise (traffic, HVAC harmonics)           |
+-------------------------------------------------------------------------+
                                    │
                                    ▼
+-------------------------------------------------------------------------+
|             STAGE 3: Virtual-Source Interferometry & Stacking           |
|   • Pairwise cross-correlation of all DAS channel traces                |
|   • Empirical Green's Function (EGF) extraction via phase-weighted stack|
+-------------------------------------------------------------------------+
                                    │
                                    ▼
+-------------------------------------------------------------------------+
|                STAGE 4: Dispersion Curve Inversion                      |
|   • Multi-Channel Analysis of Surface Waves (MASW) transform            |
|   • Extraction of fundamental-mode Rayleigh phase velocities            |
+-------------------------------------------------------------------------+
                                    │
                                    ▼
+-------------------------------------------------------------------------+
|              STAGE 5: 3D Shear-Wave Velocity ($V_s$) Tomography          |
|   • Non-linear least squares inversion of localized dispersion curves   |
|   • Resolution of lateral & vertical lithological boundaries (0–100 m)  |
+-------------------------------------------------------------------------+
Stage 1: Event Detection and Network Validation
The interrogator recorded terabytes of raw strain data daily. To isolate true thunderquakes from false triggers (such as passing heavy trucks, freight trains, or construction operations), the processing engine cross-referenced timing markers against the National Lightning Detection Network (NLDN) database.
Each detected thunder event was matched to a specific cloud-to-ground flash with known geographic coordinates, strike elevation, and peak current. Events showing peak currents below 10 kiloamperes (kA) were discarded to ensure the incident acoustic wavefield carried sufficient energy to penetrate the deep regolith.
Stage 2: Signal Conditioning and Wavefield Separation
Because thunder generates a complex wave train comprising both direct sound traveling horizontally through air ($v \approx 340\ \text{m/s}$) and air-coupled seismic surface waves traveling through rock ($v \approx 800\text{--}2,500\ \text{m/s}$), velocity filtering was applied in the frequency-wavenumber ($f$-$k$) domain.
The direct acoustic wave, moving at sonic speed, appears as a steep linear feature in $f$-$k$ space. By designing an $f$-$k$ fan filter, the researchers suppressed this air wave, isolating the dispersive Rayleigh waves propagating through the solid geology.
Stage 3: Virtual-Source Interferometry
Because lightning strikes occur at unpredictable spatial coordinates in the sky, they represent random, uncontrolled energy sources. The team resolved this by applying seismic interferometry. By mathematically cross-correlating the recorded thunderquake wavefield at sensor station $A$ with sensor station $B$, the wavepath between the sky and station $A$ cancels out.
This operation effectively transforms station $A$ into a "virtual seismic source" firing an impulse that travels directly to station $B$, yielding the exact empirical Green's function of the inter-station medium. Stacking hundreds of virtual-source gathers from 458 separate strikes increased the signal-to-noise ratio, revealing stable surface wave packets.
Stage 4: Dispersion Curve Inversion
Rayleigh waves are inherently dispersive: higher-frequency components have short wavelengths and probe only the top few meters of soil, while lower-frequency components have longer wavelengths that penetrate tens to hundreds of meters into bedrock.
By calculating dispersion curves (phase velocity as a function of frequency) across the 5 to 50 Hz spectrum, the researchers quantified how wave speed varied as a function of depth along every linear segment of the 4.2 km fiber path.
Stage 5: 3D Shear-Wave Velocity ($V_s$) Inversion
Finally, the local dispersion curves were inverted using a generalized non-linear least-squares algorithm to construct 1D vertical shear-wave velocity profiles beneath each channel, which were then interpolated into 2D vertical cross-sections and 3D volumetric tomograms.
Shear-wave velocity ($V_s$) is a direct mechanical indicator of rock stiffness, density, and fracture density:
- Unconsolidated clay and soil: $V_s < 250\ \text{m/s}$
- Weathered, highly fractured limestone: $V_s \approx 300\text{--}600\ \text{m/s}$
- Competent, intact carbonate bedrock: $V_s > 1,200\ \text{m/s}$
The team produced high-resolution images down to a depth of roughly 100 meters, completing the first-ever passive structural assessment driven entirely by lightning thunderquakes.
Case Study Validation: Mapping the Karst Subsurface of State College
The geological environment underlying Pennsylvania State University provided a rigorous proving ground for this approach. State College sits within the Nittany Valley of the Appalachian Ridge and Valley province, an ancient folded belt characterized by thick sequences of Ordovician limestone and dolomite. Carbonate landscapes of this nature are notoriously prone to karstification—the chemical dissolution of bedrock by acidic groundwater.
  0 m ──┌──────────────────────────────────────────────────────────┐
        │ Soil & Regolith Layer (Vs < 250 m/s)                      │
        ├──────────────────────────────────────────────────────────┤
        │ Weathered Epikarst & Fracture Zone                       │
        │ [Low-Vs Anomaly 1]              [Low-Vs Anomaly 2]       │
        │ (Vs ≈ 280-350 m/s)             (Dissolution Void Zone)   │
        ├──────────────────────────────────────────────────────────┤
        │                                                          │
        │ Competent Carbonate Bedrock (Vs > 1,400 m/s)             │
        │                                                          │
100 m ──┴──────────────────────────────────────────────────────────┘
Karst environments develop hidden subterranean voids, dissolution channels, unstable soil pinnacles, and sudden-collapse sinkholes. For civil engineers and municipal planners, mapping these hidden structural weak zones before they undermine buildings, highways, or utility lines is a continuous challenge.
The thunderquake tomographic survey generated clear, high-contrast velocity cross-sections across the campus, identifying four pronounced low-velocity anomalies ($V_s \approx 280\text{--}350\ \text{m/s}$) embedded within high-velocity host bedrock ($V_s > 1,400\ \text{m/s}$) at depths between 10 and 45 meters.
To confirm that these low-velocity anomalies were genuine geological features and not processing artifacts, the team cross-validated their findings against three independent datasets:
1. Interferometric Synthetic Aperture Radar (InSAR)
Using data from the European Space Agency's Sentinel-1 radar satellite constellation, geophysicists conducted multi-temporal InSAR displacement analysis across the campus spanning five years.
The surface deformation maps revealed localized subsidence bowls settling at rates between 3 and 7 millimeters per year. When overlaid onto the thunderquake tomograms, these subsidence zones aligned with the low-velocity anomalies mapped by the DAS array.
2. Geotechnical Borehole Logs
The team accessed historical and recent exploratory drilling logs compiled by the Penn State Office of Physical Plant for campus construction projects. Core samples extracted from locations directly above the primary low-velocity anomaly confirmed the presence of deeply weathered residual soil, mud-filled fractures, and void spaces within the upper limestone sequence.
In contrast, boreholes drilled outside the anomaly recovered solid, unweathered limestone cores matching the high-velocity zones indicated in the tomograms.
3. Multi-Channel Analysis of Surface Waves (MASW)
Independent active-source seismic surveys conducted using mechanical sledgehammer impacts confirmed the phase velocities derived from the thunderquake interferometry down to a depth of 25 meters, verifying that the passive lightning source matched the imaging accuracy of traditional exploration tools.
"We demonstrated the first successful seismic imaging using thunderquakes," stated Tieyuan Zhu, associate professor of geosciences at Penn State and the study's corresponding author. "Not only does this research serve as a proof of concept for using thunderquakes as seismic sources for tomography, but DAS provided a new way to observe the interaction between the atmosphere and the solid Earth".
Principle 1: The Transition from Active to Passive Seismic Sourcing
The success of the Penn State experiment clarifies a broader operational shift in geophysics: moving away from capital-intensive, environmentally intrusive active energy sources toward passive environmental mechanics.
Traditional seismic imaging relies on active sources—explosive dynamite charges or multi-ton hydraulic vibrator trucks (vibroseis). While effective for petroleum exploration and deep crustal profiling, active seismic methodologies suffer from severe operational constraints in modern urban and environmentally sensitive settings:
- Regulatory and Permitting Hurdles: Operating heavy industrial trucks or blasting explosives in densely populated municipal zones requires months of bureaucratic permitting and encounters strict noise and vibration regulations.
- Environmental Disruption: Vibroseis operations and explosive shot-holes disturb delicate topsoils, induce localized vegetation damage, and can damage buried municipal utility networks.
- Prohibitive Capital Costs: A standard 3D active seismic survey running over a few square kilometers costs hundreds of thousands to millions of dollars in equipment rental, mobilization, and labor.
       ACTIVE SEISMIC METHODS               PASSIVE THUNDERQUAKE METHOD
┌─────────────────────────────────────┐ ┌─────────────────────────────────────┐
│ • Explosives / Vibroseis trucks     │ │ • Lightning discharge (Natural)     │
│ • Millions in capital costs         │ │ • Free, zero-carbon energy source   │
│ • Permitting & urban restrictions   │ │ • Uses pre-existing dark fiber      │
│ • Destructive surface impacts       │ │ • Continuous, non-invasive imaging  │
│ • Snapshots in time (one-off)       │ │ • Repeatable time-lapse monitoring  │
└─────────────────────────────────────┘ └─────────────────────────────────────┘
Passive seismology historically relied on natural earthquakes to overcome these challenges. However, in intraplate tectonic settings—such as the eastern and central United States, northern Europe, and central Australia—earthquakes of sufficient magnitude ($M > 3.0$) are rare and irregularly distributed in time and space.
A passive array waiting for tectonic earthquakes in stable continental interiors might wait decades to collect enough raypath coverage for high-resolution imaging.
Thunderquakes fill this operational gap. Severe thunderstorms occur regularly across temperate, subtropical, and tropical regions. Each severe storm system unleashes dozens to hundreds of high-current lightning strikes, delivering repeated, localized, high-amplitude acoustic impulses directly into the ground.
By using storms as the primary energy source, geophysicists can execute rapid mapping earth crust projects across tectonically quiet regions without deploying artificial seismic sources.
Principle 2: Exploiting "Dark Infrastructure" for Planetary-Scale Observatories
The second fundamental principle demonstrated by this case study is the repurposing of dormant telecommunications infrastructure as permanent geophysical observatories.
Over the past three decades, telecommunications providers, municipal governments, and enterprise networks laid millions of route-kilometers of optical fiber cables across the globe. A significant fraction of these cables consists of "dark fiber"—excess glass strands installed alongside active cables to accommodate future bandwidth demand.
┌─────────────────────────────────────────────────────────────────────────┐
│              TELECOMMUNICATIONS CONDUIT BURIED UNDERGROUND               │
│  ┌─────────────────────────────────┐   ┌─────────────────────────────┐  │
│  │   Active Internet & Telecom     │   │      Dormant "Dark Fiber"   │  │
│  │    (Commercial Data Streams)    │   │      (Continuous DAS Array) │  │
│  └─────────────────────────────────┘   └──────────────┬──────────────┘  │
└───────────────────────────────────────────────────────┼─────────────────┘
                                                        │
                                                        ▼
                                        Real-Time Geological Sensor Mesh
The Penn State study demonstrates how this massive, pre-existing global web can be activated as a scientific instrument. Instead of treating telecommunications cables merely as passive data conduits, geophysicists can attach an interrogator unit to a single dark fiber and instantaneously create a continuous sensor array spanning kilometers.
This model yields several distinct operational advantages:
- Ubiquitous Urban Penetration: Fiber cables mirror human development, running under streets, alongside railway tracks, beneath airport runways, and through industrial zones where traditional sensor deployment is impossible.
- Permanent, Continuous Monitoring: Once plugged into an interrogator, a fiber network operates 24/7/365, enabling 4D time-lapse imaging to track changing groundwater levels, sub-surface compaction, and permafrost thawing.
- Extreme Spatial Resolution: Traditional arrays place sensors every 25 to 50 meters; DAS provides continuous strain measurements every single meter, eliminating spatial aliasing and resolving micro-scale structural faults.
However, scaling dark-fiber sensing networks introduces technical challenges that geophysical engineers are actively working to resolve:
- Directional Sensitivity Constraints: Standard straight fiber cables are sensitive exclusively to longitudinal strain along the axis of the cable. Waves striking the cable perpendicularly at a 90-degree angle produce minimal axial strain and are poorly recorded. Researchers are addressing this via helically wound cables and complex zigzag routing.
- Coupling Inconsistencies: The acoustic-to-strain conversion depends on how the cable is housed. Fiber cables directly buried in soil achieve better mechanical coupling than cables loosely suspended inside hollow plastic conduits.
- Massive Data Volumes: A single DAS interrogator interrogating 5,000 channels at 1 kHz generates several terabytes of raw continuous data per day, demanding automated edge-computing algorithms to perform real-time data decimation, event picking, and compression.
Principle 3: Cross-Disciplinary Convergence of Atmosphere and Lithosphere
The intersection of atmospheric electricity and seismology breaks down a historical disciplinary divide between meteorology and solid-earth geophysics. For over a century, atmospheric scientists focused upward on cloud electrification and plasma dynamics, while seismologists focused downward on fault rupture mechanics and lithospheric velocities.
The thunderquake paradigm forces these fields together into a unified Earth-system framework. The acoustic-to-seismic conversion acts as a bidirectional diagnostic tool:
                       BIDIRECTIONAL DIAGNOSTIC COUPLING
                                       │
     ┌─────────────────────────────────┴─────────────────────────────────┐
     ▼                                                                   ▼
[Atmosphere -> Solid Earth]                         [Solid Earth -> Atmosphere]
Using thunder acoustic shock                        Using dense DAS ground arrays
to map subsurface lithology,                        to reconstruct 3D lightning
karst voids, and shear velocities. channel geometry & energy dissipation.- Atmospheric Physics to Geophysics: Seismologists use the acoustic wavefield of thunder to map subsurface velocity structures, locate hidden faults, track water table variations, and monitor civil infrastructure.
- Geophysics to Atmospheric Physics: Meteorologists can use dense subsurface DAS arrays to reconstruct the 3D geometry, tortuosity, and energy dissipation profile of lightning channels in the sky. Because sound waves from different segments of a tortuous lightning channel arrive at the ground at different times, DAS back-projection algorithms can track the precise path of lightning channels through the clouds.
This feedback loop is particularly relevant when considered alongside global climate models. Atmospheric physics indicates that for every 1°C increase in global mean atmospheric temperatures, convective available potential energy (CAPE) rises, driving an estimated 12% increase in lightning strike frequency.
Projections published by the Intergovernmental Panel on Climate Change (IPCC) suggest lightning activity across mid-latitude continental zones could increase by up to 50% by 2100.
As severe storms intensify and strike with greater frequency, the availability of natural thunderquake seismic sources will expand, increasing the viability of thunder-driven passive seismic tomography in storm-prone regions worldwide.
Comparative Assessment: Seismic Methodologies for Near-Surface Characterization
To contextualize the operational value of thunderquake tomography, the method must be evaluated against established active, passive, and ambient seismic imaging techniques:
| Evaluation Metric | Thunderquake DAS Tomography | Ambient Noise Tomography (ANT) | Active-Source MASW / Reflection | Earthquake Tomography |
|---|---|---|---|---|
| Primary Energy Source | Cloud-to-ground / Intra-cloud lightning | Cultural noise (traffic, wind, ocean microseisms) | Controlled explosives or Vibroseis trucks | Tectonic fault slip events |
| Dominant Frequency Range | 5 Hz to 130 Hz (Broadband) | 0.1 Hz to 10 Hz (Low frequency) | 10 Hz to 100 Hz | 0.01 Hz to 5 Hz (Very low) |
| Effective Depth of Investigation | 1 meter to ~100 meters | 50 meters to >10 kilometers | 1 meter to ~50 meters | 5 kilometers to >700 kilometers |
| Spatial Resolution | Ultra-high (1–2 meters laterally) | Medium (tens to hundreds of meters) | High (2–5 meters laterally) | Coarse (several kilometers) |
| Operational Feasibility in Urban Centers | High (utilizes dark fiber) | High (utilizes background noise) | Very Low (permitting and disruption barriers) | High (passive, but requires waiting for quakes) |
| Carbon & Environmental Impact | Zero net emissions | Zero net emissions | High (fuel consumption, blasting) | Zero net emissions |
| Primary Limitation | Weather-dependent (requires thunderstorm activity) | Requires long integration times (weeks/months) | Extreme capital and logistical costs | Rare in intraplate continental interiors |
This comparison highlights that thunderquake tomography occupies a distinct niche in near-surface geophysics. While Ambient Noise Tomography (ANT) struggles to achieve sub-meter resolution in the upper 50 meters due to low dominant frequencies, and active reflection seismic surveys are too costly and disruptive for dense urban deployment, thunderquakes provide high-energy, broadband impulses that bridge the resolution gap between superficial geotechnical sounding and deep lithospheric imaging.
Strategic Applications: From Urban Geohazards to Extraterrestrial Seismology
The validation of thunderquake tomography opens immediate operational pathways across engineering geology, hazard mitigation, and planetary exploration.
                APPLICATION HORIZONS OF THUNDERQUAKE SEISMOLOGY
                                       │
     ┌─────────────────────────────────┼─────────────────────────────────┐
     ▼                                 ▼                                 ▼
[Urban Infrastructure]       [Permafrost & Glaciology]        [Planetary Exploration]
• Karst sinkhole mapping      • Active-layer thaw tracking     • Venus surface imaging
• Fault & fracture detection  • Ice shelf fracture imaging     • Titan hydrocarbon seas
• Foundation stability        • Remote Arctic monitoring       • Dust storm seismology
1. Urban Infrastructure and Karst Hazard Mitigation
As demonstrated in State College, municipal karst hazards present immense financial and safety risks. In the United States alone, sinkholes cause hundreds of millions of dollars in structural damage annually.
By connecting DAS interrogators to municipal dark-fiber loops, transportation departments and city engineers can conduct passive structural assessments:
- Continuously update 3D baseline stiffness maps of foundational soils beneath bridges, rail corridors, and skyscrapers.
- Detect the formation of subterranean voids and soil piping channels months before catastrophic surface collapse occurs.
- Monitor groundwater depletion and aquifer compaction following seasonal storm cycles.
2. Arctic Permafrost and Cryosphere Monitoring
In high-latitude Arctic regions, rising global temperatures are accelerating the thaw of permafrost, destabilizing pipelines, roads, and native communities.
Deploying traditional seismic crews in these remote, freezing terrains is expensive and hazardous. However, thousands of kilometers of subsea and overland fiber cables already link Arctic communities.
Because the Arctic is experiencing a documented surge in convective summer thunderstorms, thunderquake DAS arrays can monitor the depth of the active permafrost thaw layer over time, tracking changes in subsurface shear-wave velocity caused by ice-to-water phase transitions.
3. Extraterrestrial Planetary Exploration
The implications of atmospheric-solid coupling extend beyond Earth. A central challenge in planetary science is imaging the crustal structures of other planetary bodies where tectonic quakes are weak or rare.
- Venus: The surface of Venus presents an extreme environment: temperatures reach 460°C and atmospheric pressure exceeds 90 atmospheres. Conventional landers with mechanical seismometers fail within hours under these conditions. However, Venus possesses a dense, highly convective atmosphere with observed optical and electrical lightning activity. High-altitude floating aerobots or orbiters monitoring acoustic infrasound generated by Venusian atmospheric discharges could infer the mechanical properties of the Venusian lithosphere without enduring surface conditions.
- Titan: Saturn's largest moon possesses a dense nitrogen atmosphere, liquid methane-ethane hydrological systems, and convective storm systems that produce atmospheric electrical discharges. Passive acoustic-to-seismic coupling concepts could enable future landers to map the thickness of Titan's outer ice crust.
"Knowing how atmospheres interact with surfaces will also be helpful as we continue to explore outside our own planet," Zhu noted. "Quakes on other planets and moons aren't well understood, so having a different source for seismic imaging might be necessary".
Technical Challenges and Forward-Looking Milestones
While the Penn State study represents an important milestone in environmental geophysics, widespread operational deployment requires solving several remaining theoretical and engineering bottlenecks:
1. Source Anisotropy and 3D Wavefield Complexity
Lightning channels are rarely vertical; they branch tortuously across kilometers of atmosphere. This geometric complexity causes the incident acoustic shockwave to hit the ground from multiple back-azimuths simultaneously, introducing wavefield distortion and phase shifts.
Developing automated machine learning algorithms capable of deconvolving complex, multi-branched lightning geometries into idealized point sources will be crucial for refining tomographic resolution.
2. Fiber Directionality and Multi-Component Sensing
Standard fiber-optic cables remain preferentially sensitive to axial strain. To construct complete 3-component ($3C$) seismic tensors equivalent to traditional triaxial seismometers, fiber manufacturers are engineering structured multicore fibers and 3D woven fiber geometries that capture transverse and vertical motion alongside longitudinal strain.
3. Real-Time Edge Processing Pipelines
Streaming terabytes of high-rate data per hour from regional fiber grids presents a major network and computational load. The next technological milestone involves integrating field-programmable gate arrays (FPGAs) and specialized edge-computing processors directly into interrogator hardware.
These edge processors will filter out environmental noise, detect lightning events via automated cross-correlation, and output inverted dispersion curves in real time, reducing storage and transmission requirements by orders of magnitude.
       RAW HIGH-RATE STREAM                         PROCESSED GEOTECHNICAL DATA
┌─────────────────────────────────────┐         ┌─────────────────────────────────┐
│ • 5,000 Channels @ 1 kHz            │  ====>  │ • Real-time Phase Velocities    │
│ • >2 Terabytes / Interrogator / Day │  [FPGA] │ • Automated Void Alerts         │
│ • Continuous Optical Backscatter    │  [Edge] │ • Inverted 3D Shear Profiles    │
└─────────────────────────────────────┘         └─────────────────────────────────┘
The success of using lightning thunderquakes to map the shallow crust marks the opening of a new frontier in passive Earth observation. By turning the destructive power of atmospheric electrical storms into a continuous subsurface illumination tool, geophysicists have bridged the boundary between atmospheric physics and solid-earth geology.
As fiber-optic sensing grids expand and global storm dynamics shift, the sky above and the ground beneath are operating not as isolated systems, but as an integrated, self-illuminating geophysical laboratory.
Reference:
- https://www.psu.edu/news/earth-and-mineral-sciences/story/thunderquakes-new-way-image-earths-subsurface
- https://www.lifescience.net/publications/2163402/imaging-earths-subsurface-with-thunderstorm-genera/
- https://www.sciencenews.org/article/thunderquakes-shake-ground-map-it
- https://eos.org/articles/thunderquakes-map-the-subsurface
- https://www.gazetai.com/en/news/science/thunderstorms-produce-seismic-signals-that-map-shallow-crust-2562/
- https://pubs.geoscienceworld.org/ssa/bssa/article/114/2/1124/628512/Wavefield-Modeling-and-Analysis-of-Lightning
- https://connectsci.au/news/news-parent/9973/Harnessing-thunderquakes-to-image-below-inside-the
- https://www.thebrighterside.news/post/thunderquakes-turn-storms-into-a-new-tool-for-imaging-underground-hazards/
- https://www.researchgate.net/publication/377892849_Tracking_Lightning_through_3D_Thunder_Source_Location_with_Distributed_Acoustic_Sensing
- https://www.discovermagazine.com/thunderquakes-could-help-scientists-see-beneath-earth-s-surface-49586