
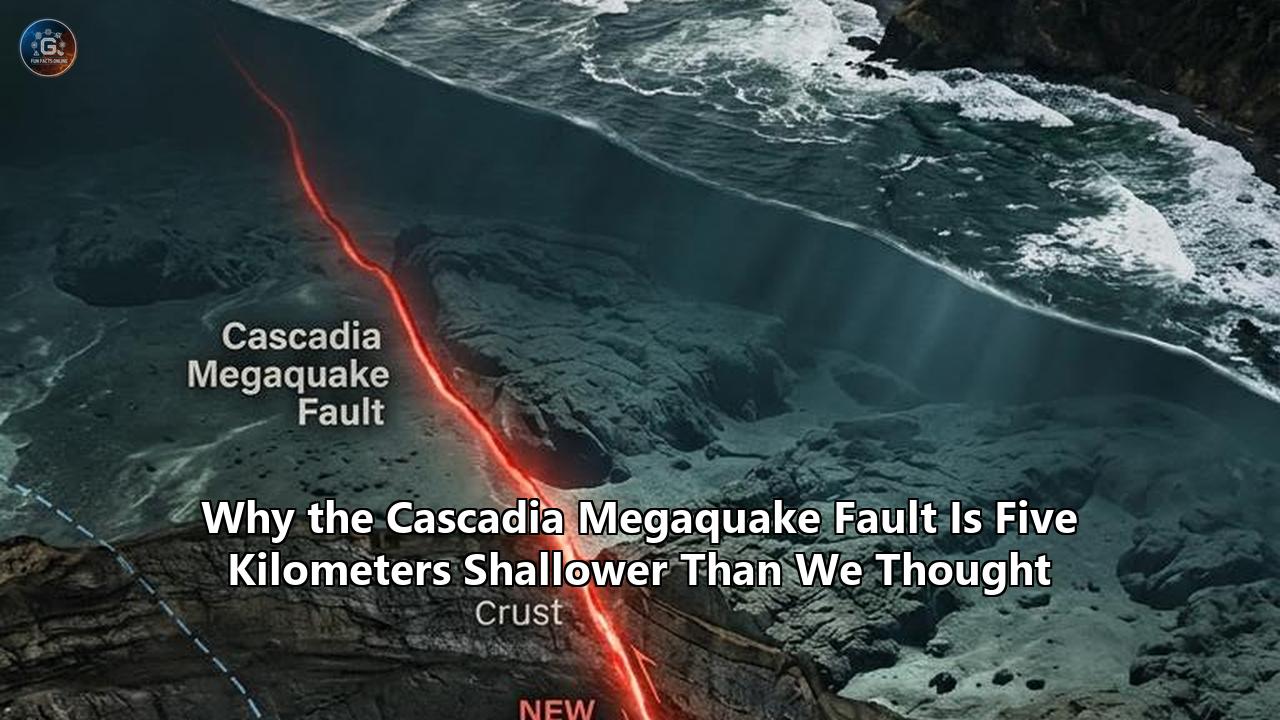
For decades, seismic hazard models for the Pacific Northwest operated on a critical spatial assumption: that the locked interface where the oceanic crust slips beneath the continent lay approximately 25 kilometers (15.5 miles) below the northern Oregon coastline.
New geophysical imaging and dense array seismology have overturned that baseline. Data presented at the Seismological Society of America by U.S. Geological Survey (USGS) geophysicist Dr. Erin Wirth, integrated with high-resolution marine acoustic reflection data from the CAscadia Seismic Imaging Experiment (CASIE21), reveals that the plate boundary sits at a depth of approximately 20 kilometers (12.4 miles) near the northern Oregon shore.
A five-kilometer vertical reduction—representing a 20 percent upward shift toward the surface—drastically alters the physics of wave propagation. Because high-frequency seismic energy attenuates as a function of distance through the Earth's crust, shortening the path between the seismogenic zone and surface infrastructure increases estimated peak ground acceleration (PGA) by 9 to 17 percent along the northern Oregon coast.
Compounding this structural revision, the onshore seismic array detected a previously unmapped deep sedimentary basin beneath Tillamook, Oregon. The low-velocity geometry of this geological formation acts as a resonant trap, concentrating and prolonging the duration of severe ground shaking.
The Juan de Fuca plate plunges beneath North America across the 1,000-kilometer (620-mile) expanse of the Cascadia subduction zone. With the region sitting 326 years into an average 480- to 505-year full-margin recurrence cycle, these revised numbers directly impact engineering standards, insurance risk calculations, and emergency response plans across the Pacific Northwest.
+-----------------------------------------------------------------------------------+
|                        SUMMARY OF REVISED SEISMIC PARAMETERS                      |
+------------------------------------+-----------------------+----------------------+
| Parameter                          | Previous Model        | Updated CASIE21 /    |
|                                    |                       | Nodal Array Data     |
+------------------------------------+-----------------------+----------------------+
| Slab Interface Depth (N. Oregon)   | ~25.0 km (15.5 mi)    | ~20.0 km (12.4 mi)   |
| Depth Reduction                    | Baseline              | -5.0 km (-20.0%)     |
| Peak Ground Acceleration (Coast)   | Baseline Target       | +9% to +17% increase |
| Structural Segmentation            | Uniform Megathrust    | 4 Distinct Domains   |
| Tillamook Subsurface Basin         | Undefined / Basement  | Mapped Resonance Trap|
| Full-Margin Rupture Recurrence     | ~500 Years            | ~480–505 Years       |
| Southern Segment Partial Recurrence| ~240 Years            | ~220–240 Years       |
| Time Elapsed Since Last M9.0 Event | 326 Years (Jan 1700)  | 326 Years (Jan 1700) |
+------------------------------------+-----------------------+----------------------+
Quantifying the Physics: How a 5,000-Meter Depth Reduction Escalates Shaking
The mechanical severity of an earthquake is governed by the distance seismic waves must traverse before discharging energy into surficial rock and unconsolidated soil. In earthquake engineering, this distance is quantified via hypocentral distance ($R_{hypo}$) and the closest distance to the rupture plane ($R_{rup}$).
                                SURFACE INFRASTRUCTURE
                     [ Tillamook / Coastal Cities ]  [ Portland Basin ]
                                |                           |
                                |                           |
                                v                           v
   0 km ------------------------------------------------------------------- Ground Level
          \                                               /
           \  Overriding North American Plate            /  Sedimentary
            \                                           /   Basin Trap
             \                                         /
  10 km ------\---------------------------------------/--------------------
               \
                \  PREVIOUSLY ASSUMED: ~25 km Depth  [ Attenuation Buffer: 25 km ]
                 \
  20 km ----------* UPDATED INTERFACE: ~20 km Depth  [ Attenuation Buffer: 20 km ]
                   \   (5 km / 20% closer to surface -> +9% to +17% PGA)
                    \
  25 km -------------\-----------------------------------------------------
                      \   Subducting Juan de Fuca Plate
                       \  (Diving at ~40 mm/year)
  30 km ----------------\--------------------------------------------------
When a fault ruptures, body waves—compressional ($P$) waves and shear ($S$) waves—radiate omnidirectionally. As these wave fronts expand, their energy density decays due to geometric spreading and anelastic attenuation (the intrinsic damping of rock, denoted by the seismic quality factor $Q$).
The geometric attenuation of peak ground acceleration roughly scales inversely with distance ($1/R$). By bringing the locked plate boundary from 25 kilometers down to 20 kilometers beneath the coastline, the primary wavefront retains a significantly higher energy density upon reaching the surface.
$$\text{Geometric Amplitude Decay} \propto \frac{1}{R_{rup}}$$
In anelastic terms, high-frequency energy (1.0 Hz to 10.0 Hz)—the specific band that drives peak acceleration and damages low-to-mid-rise rigid structures—decays exponentially according to the travel time path:
$$A(f) = A_0 \cdot \exp\left(-\frac{\pi \cdot f \cdot t}{Q}\right)$$
Where:
- $A_0$ is initial source amplitude,
- $f$ is seismic frequency,
- $t$ is travel time ($\text{Distance} / \text{Wave Velocity}$),
- $Q$ is the dimensionless crustal quality factor.
Cutting five kilometers of travel time through dampening upper-crustal lithologies prevents critical high-frequency wave degradation. In practical ground-motion prediction equations (GMPEs), reducing the depth to the top of the rupture ($Z_{tor}$) and reducing $R_{rup}$ elevates median expected spectral accelerations ($S_a$) across broad frequency bands.
According to calculations presented by Dr. Wirth, this 5-kilometer geometric adjustment yields a direct increase in modeled Peak Ground Acceleration of 9 to 17 percent across the northern Oregon coastal corridor. In terms of raw dynamic loading, an engineered asset previously projected to experience 0.40 $g$ (where $g$ represents the acceleration of gravity, $9.81\text{ m/s}^2$) under an $M_w 9.0$ event must now be modeled to withstand between 0.44 $g$ and 0.47 $g$.
Marine Seismic Profiling: The CASIE21 Fleet Data
The revised fault geometry is anchored in empirical data gathered during the CAscadia Seismic Imaging Experiment (CASIE21). Carried out aboard the National Science Foundation’s 235-foot seismic flagship, the R/V Marcus G. Langseth (operated by Columbia University’s Lamont-Doherty Earth Observatory), the 41-day expedition deployed an advanced marine geophysical array across the plate interface.
+-----------------------------------------------------------------------------------+
|                        CASIE21 SURVEY TECHNICAL SPECIFICATIONS                    |
+------------------------------------+----------------------------------------------+
| Research Vessel                    | R/V Marcus G. Langseth (NSF / Lamont-Doherty)|
| Survey Scope                       | ~900 km along-strike (Vancouver Is. to CA)   |
| Total Reflection Profile Length    | ~5,500 km of high-resolution acoustic data   |
| Acoustic Sound Source              | 6,600 cubic inch tuned airgun array          |
| Hydrophone Receiver Cable          | 15.0 km (9.3 mi) digital multichannel streamer|
| Ocean Bottom Seismometers (OBS)    | 63 short-period, 4-component instruments     |
| Total OBS Deployment Stations      | 120 marine shelf-to-trench profile locations |
| Data Processing Methodology        | 3D Pre-Stack Depth Migration (PSDM) & FWI    |
+------------------------------------+----------------------------------------------+
Prior to this survey, the regional geometry of the offshore megathrust relied heavily on seismic reflection lines shot in the 1980s. Those legacy datasets utilized short acoustic receiver cables (typically under 3 kilometers) and analog processing techniques, leaving the offshore contact zone—the exact region where catastrophic subduction ruptures initiate—poorly resolved.
CASIE21 Marine Seismic Acquisition Layout:

   R/V Marcus G. Langseth
   [===o===]=======================================================> Tow Direction
      |   \
      |    \-- Airgun Array Source (6,600 cu. in.)
      |
      \======= 15-Kilometer Digital Hydrophone Streamer Cable =======>
                 o     o     o     o     o     o     o     o     o
                 |     |     |     |     |     |     |     |     |
                 v     v     v     v     v     v     v     v     v
              (Returning acoustic wave echoes from down to 30 km depth)
The R/V Marcus G. Langseth surveyed using a 6,600-cubic-inch tuned airgun array capable of penetrating up to 30 kilometers through oceanic crust, accompanied by a 15-kilometer-long digital hydrophone streamer. This configuration provided the long-offset acoustic ray paths necessary to calculate precise velocity models and map deep geological reflections.
The acoustic reflection data, processed through Pre-Stack Depth Migration (PSDM) and Full Waveform Inversion (FWI), established that the plate boundary does not descend at a static, gradual plane. Instead, the subducting plate exhibits distinct structural variations, along-strike warping, and discrete tectonic divisions.
+-----------------------------------------------------------------------------------+
|                       FOUR STRUCTURAL MEGATHRUST SEGMENTS                         |
+-----------------------+--------------------------+--------------------------------+
| Segment Designation   | Geographic Extent        | Structural Characteristics     |
+-----------------------+--------------------------+--------------------------------+
| Segment A (Northern)  | S. Vancouver Island to   | Extremely smooth, low-angle    |
|                       | Columbia River (WA)      | dip; extends under Olympic Pen.|
+-----------------------+--------------------------+--------------------------------+
| Segment B (N. Oregon) | Columbia River to        | Shallower slab (~20 km depth); |
|                       | Central Oregon Coast     | Underthrust Tillamook basin    |
+-----------------------+--------------------------+--------------------------------+
| Segment C (S. Oregon) | Central Oregon to        | Thicker sediment underthrust;  |
|                       | Cape Blanco              | Low-velocity outer wedge       |
+-----------------------+--------------------------+--------------------------------+
| Segment D (Southern)  | Cape Blanco to           | Fragmented lower plate; high   |
|                       | Mendocino Triple Junction| historic recurrence (~220 yr)  |
+-----------------------+--------------------------+--------------------------------+
Leading marine seismologist Dr. Suzanne Carbotte emphasized the clarity provided by the modern sensor array. The data confirms that the megathrust splits into four distinct megathrust domains separated by transverse strike-slip faults and lower-plate tears.
Off the coast of Washington (Segment A), the interface is exceptionally smooth and dips at an unusually shallow angle, extending the contact zone directly beneath the Olympic Peninsula.
Off northern Oregon (Segment B), the CASIE21 imaging, when joined with onshore sensor arrays, revealed that the top of the oceanic basalt sits higher within the lithospheric column than previously modeled. This matches structural observations of lower-plate fragmentations, where localized tectonic warping lifts the plate interface 5 kilometers closer to coastal communities.
Onshore Verification: The 192-Node Seismic Array and Tillamook Basin
To ground-truth the offshore marine data as the slab transitions under land, Dr. Erin Wirth and her USGS research team deployed an onshore network of 192 autonomous nodal seismometers across northern Oregon.
          CROSS-SECTION: NORTHERN OREGON TRANSECT (NODAL ARRAY)

 West                                                               East
 Pacific Ocean       Tillamook Coast                     Portland Basin
       |                    |                                  |
 ~~~~~~v~~~~~~~~~~~~~~~~~~~~v~~~~~~~~~~~~~~~~~~~~~~~~~~~~~~~~~~v~~~~~~~
 ~~~~~~~~~~~~~~~~~~  +--------------+                  +---------------+
  Accretionary Wedge |  Tillamook   |  Siletz Terrane  |   Tualatin    |
                     |  Sed. Basin  |  (Crystalline    | Sed. Basin    |
                     |  (Low-Vs)    |   Basement)      | (Low-Vs)      |
                     +--------------+                  +---------------+
                           /                                /
                          /                                /
                         /                                /
  ----------------------* <--- 20 km Depth (Juan de Fuca Slab Interface)
                       /
                      /
                     /
  ------------------/--------------------------------------------------
Deployed over successive field seasons in 2021 and 2022, these compact geophones formed a high-density linear transect stretching from the coastal bluffs of Tillamook eastward across the Oregon Coast Range into the Portland metropolitan area.
By recording ambient seismic noise, micro-seismicity, and teleseismic arrivals from deep global earthquakes, the team applied receiver-function analysis and $H\text{-}\kappa$ stacking to calculate the precise shear-wave velocity ($V_s$) discontinuities of the lower crust.
The nodal network yielded two critical findings:
+-----------------------------------------------------------------------------------+
|                        ONSHORE SEISMIC ARRAY DISCOVERIES                          |
+------------------------------------+----------------------------------------------+
| 1. Slab Depth Confirmation         | Direct confirmation of the Juan de Fuca plate|
|                                    | crust at ~20 km depth at the coastline.      |
+------------------------------------+----------------------------------------------+
| 2. Tillamook Basin Identification  | First direct structural mapping of a deep    |
|                                    | sedimentary basin directly beneath Tillamook.|
+------------------------------------+----------------------------------------------+
| Shear Wave Velocity ($V_s$) Drop   | Reductions down to <1,200 m/s in basin fill   |
|                                    | compared to >2,800 m/s in igneous basement.  |
+------------------------------------+----------------------------------------------+
| Wave Mechanics Consequence         | Trapping and refraction of horizontal shear  |
|                                    | waves, causing 2x to 3x duration increases.  |
+------------------------------------+----------------------------------------------+
The Tillamook Sedimentary Resonance Trap
Prior regional models characterized the upper crust of northern Oregon as a relatively continuous block of early Eocene oceanic basalt known as the Siletz Terrane. The nodal array revealed that beneath Tillamook, the crystalline basement is down-dropped, forming a deep sedimentary basin filled with low-density, unconsolidated-to-semiconsolidated Cenozoic marine sediments.
In earthquake dynamics, a sedimentary basin behaves like a fluid-filled resonator. When shear waves propagating upward from the megathrust hit the sharp velocity contrast at the basin's bottom boundary, two distinct phenomena occur:
- Velocity Retardation and Wave Amplification: As seismic waves transition from high-velocity crystalline basement rock ($V_s \ge 2.8\text{ km/s}$) into soft basin sediments ($V_s \le 1.2\text{ km/s}$), the principle of energy flux conservation dictates that wave speed drops while physical amplitude surges:
$$\rho_1 V_{s1} A_1^2 = \rho_2 V_{s2} A_2^2 \implies A_2 = A_1 \sqrt{\frac{\rho_1 V_{s1}}{\rho_2 V_{s2}}}$$
- Basin Edge Reflection and Constructive Interference: High-angle seismic energy entering the basin becomes trapped along the edges due to total internal reflection. Instead of passing through, the energy bounces laterally across the basin.
SEISMIC WAVE TRAPPING IN SEDIMENTARY BASIN:

     Incoming S-Wave Front
              ||
              ||
              \/
   +-------------------------------------------------------------+
   | Basalt Bedrock (Vs = 2.8 km/s)                              |
   |           \                                                 |
   |            \      +-----------------------------------+     |
   |             \     | Sedimentary Fill (Vs = 1.1 km/s)  |     |
   |              \--->|    /\      /\      /\             |     |
   |                   |   /  \    /  \    /  \   Trapped  |     |
   |                   |  /    \  /    \  /    \  Waves    |     |
   |                   +-----------------------------------+     |
   |                             Basin Floor Reflectors          |
   +-------------------------------------------------------------+
This transforms a standard shaking duration of 60 to 90 seconds into an elongated, resonant event lasting upwards of 300 to 420 seconds (5 to 7 minutes).
This basin trapping mechanism closely mirrors what seismologists have observed in the Seattle Basin and the Tualatin Basin near Portland. For low-frequency structures—such as long-span bridges, school gymnasiums, transmission towers, and multistory buildings—this extended duration creates severe structural fatigue.
Statistical Clocks: Recurrence Intervals and Rupture Probability
Paleoseismic analysis along the Pacific Northwest margin has established a detailed chronological record of prehistoric ruptures across the Holocene. Led by marine geologist Dr. Chris Goldfinger and corroborated by onshore paleoseismic trenching, the event chronology is derived from deep-sea turbidite deposits—massive underwater sediment avalanches triggered by strong seismic shaking.
+-----------------------------------------------------------------------------------+
|               HOLOCENE PALEOSEISMIC RECORD (LAST 10,000 YEARS)                    |
+------------------------------------+----------------------------------------------+
| Total Documented Turbidite Events  | 41 to 43 paleoseismic ruptures               |
| Full-Margin Ruptures ($M_w 8.7–9.2$)| 19 to 20 margin-wide events                  |
| Average Recurrence (Full Margin)   | 480 to 505 years                             |
| Southern Segment Partial Ruptures  | 22 to 24 localized events ($M_w 8.0–8.6$)    |
| Average Recurrence (S. Cascadia)   | 220 to 240 years                             |
| Date of Last Event                 | January 26, 1700 (~9:00 PM PST)              |
| Time Elapsed Since Last Event      | 326 Years                                    |
| 50-Year Probability (Full Margin)  | 10% to 14%                                   |
| 50-Year Probability (S. Segment)   | ~37%                                         |
+------------------------------------+----------------------------------------------+
The paleoseismic data indicates that the Cascadia subduction zone does not slip on an immutable schedule; rather, recurrence follows a Poisson-to-Brownian Passage Time (BPT) statistical distribution.
PALEOSEISMIC RECURRENCE TIMELINE (Past 10,000 Years)

  0 kyr (Today: 326 yrs elapsed) <----------------------------+
  |                                                           |
  |--- [1700 AD: M9.0 Orphan Tsunami Event]                   | Current Window:
  |--- [~1500 AD: Rupture]                                    | 326 yrs elapsed
  |--- [~1300 AD: Rupture]                                    | Avg: 480-505 yrs
  |--- [~900 AD: Rupture]                                     | (Southern segment
  |--- [~400 AD: Rupture]                                     |  avg: 220-240 yrs)
  |                                                           |
  v                                                           |
 10 kyr BP ---------------------------------------------------+
For full-margin ruptures ($M_w \ge 8.7$), intervals between events have been as short as 200 years and as long as 800 years, yielding a mean recurrence of 480 to 505 years.
With 326 years elapsed since the 1700 event, the margin is well within the standard deviation of its seismogenic cycle. In southern Oregon and Northern California, partial ruptures happen much more frequently—roughly every 220 to 240 years—meaning the southern segment is overdue relative to its historic mean.
+-----------------------------------------------------------------------------------+
|               PHYSICS-BASED RUPTURE WEIGHTING SCENARIOS (USGS)                    |
+----------------------+--------------------+---------------------------------------+
| Rupture Geometry     | Probability Weight | Description of Rupture Plane          |
+----------------------+--------------------+---------------------------------------+
| Mid-Depth Coastline  | 50% Weighting      | Extends directly beneath coastline;   |
|                      |                    | locks at ~20 km depth (Updated model) |
+----------------------+--------------------+---------------------------------------+
| Deep Inland          | 30% Weighting      | Rupture propagates deep inland under  |
|                      |                    | the Coast Range and Willamette Valley |
+----------------------+--------------------+---------------------------------------+
| Shallow Offshore     | 20% Weighting      | Rupture remains entirely offshore,    |
|                      |                    | concentrating high tsunami potential  |
+----------------------+--------------------+---------------------------------------+
In the USGS dynamic rupture modeling framework developed by Dr. Arthur Frankel and Dr. Erin Wirth, empirical hazard simulations weight a mid-depth rupture extending directly to the coastline at 50 percent. Placing the fault five kilometers shallower in this specific mid-depth zone increases ground-shaking estimates across all deterministic models.
Hydrodynamics: Tsunami Genesis, Shoaling, and Coastal Subsidence
A shallower megathrust fault boundary alters the mechanics of seafloor displacement and subsequent tsunami genesis.
During an $M_w 9.0$ megathrust earthquake, centuries of accumulated elastic strain energy are released over several minutes. The upper North American plate rebounds westward over the descending Juan de Fuca plate, driving massive lateral and vertical seafloor displacement.
TSUNAMI HYDRODYNAMICS AND SEAFLOOR REBOUND:

           Overriding Plate Snaps Westward
                      <=====                      Deep Ocean Tsunami Wave
  Coastline Sinks             Seafloor Thrusts Up (Speed: ~750 km/h)
  (-1.5 to -2.5 m)            (+5 to +7 m)        ~~~~~~\~~~~~~~~~/~~~~~~
        |                          |                     \       /
        v                          v                      \     /
   _ _ _ _ _ _                  _ _ _ _                    \   /
  |           |                |       |                    \ /
  | Continent |                | Wedge |                     v
  |  Crust    |                | Crust |
  +-----------+                +-------+
Seafloor Displacement and Wave Kinematics
- Lateral Slip: 12 to 20 meters (39 to 65 feet) of accumulated horizontal strain snaps oceanward.
- Vertical Uplift: 4 to 7 meters (13 to 23 feet) of upward seafloor displacement across the offshore wedge.
- Coastal Subsidence: 1.0 to 2.5 meters (3.3 to 8.2 feet) of instantaneous elastic downward drop along the shoreline.
In the open ocean, the speed of the resulting tsunami wave ($c$) is governed by the shallow-water wave equation, where $g$ is gravitational acceleration ($9.81\text{ m/s}^2$) and $d$ is water depth:
$$c = \sqrt{g \cdot d}$$
At typical Cascadia abyssal depths of 3,000 to 4,000 meters, the wave travels at 600 to 720 kilometers per hour (370 to 450 mph). Because the deformation front lies just 70 to 130 kilometers offshore, the initial wave crest strikes the Pacific Northwest coast within 15 to 30 minutes of initial rupture initiation.
+-----------------------------------------------------------------------------------+
|                       TSUNAMI WAVE PROPAGATION PARAMETERS                         |
+-----------------------+---------------------+-------------------------------------+
| Zone                  | Velocity (Speed)    | Physical Wave Characteristic        |
+-----------------------+---------------------+-------------------------------------+
| Open Abyssal Ocean    | 600–720 km/h        | Low amplitude (<2 m), broad wave-   |
| (Depth: 3,000–4,000m) | (370–450 mph)       | length (100–200 km)                 |
+-----------------------+---------------------+-------------------------------------+
| Continental Shelf     | 150–300 km/h        | Wave compressed; amplitude begins   |
| (Depth: 200–500m)     | (90–185 mph)        | rapid shoaling                      |
+-----------------------+---------------------+-------------------------------------+
| Nearshore / Estuaries | 35–55 km/h          | Run-up heights surge to 10–30 m;    |
| (Depth: <50m)         | (20–35 mph)         | High hydrodynamic bore pressure     |
+-----------------------+---------------------+-------------------------------------+
The Inundation Multiplier: Coseismic Subsidence
The shallower fault geometry updates our understanding of the flexural hinge line—the boundary where tectonic uplift transitions to coastal subsidence.
As the overriding plate stretches and rebounds oceanward, the coastal margin directly above the locked zone drops instantaneously by 1.0 to 2.5 meters. A shoreline that drops 2 meters vertically before the first wave arrives allows the tsunami surge to travel much further inland.
Low-elevation coastal zones such as Seaside, Cannon Beach, Ocean Shores, and Long Beach face run-up heights of 10 to 30 meters (33 to 100 feet), leaving little time for evacuation to high ground.
Structural Engineering Vulnerability: Shear Walls and Long-Duration Loading
The combination of higher Peak Ground Acceleration (up 9% to 17%) and extended shaking durations (up to 5 to 7 minutes) significantly increases stress on built infrastructure across Oregon and Washington.
Building performance during earthquakes is governed by dynamic cyclic ductility—a structure's capacity to absorb repeated cycles of inelastic deformation without complete structural failure. Standard building codes have historically relied on acceleration response spectra calibrated from shorter strike-slip earthquakes, such as the 1994 Northridge earthquake (duration ~15 seconds) or the 1989 Loma Prieta earthquake (duration ~20 seconds).
STRUCTURAL RESPONSE COMPARISON: STRIKE-SLIP VS. MEGATHRUST

Strike-Slip Event (e.g., Northridge / Loma Prieta):
| Shaking Duration: ~15 to 20 seconds
| Load Cycles: 10 to 15 inelastic cycles
| Energy Release: Rapid pulse, quick attenuation
+----------------------------------------------------------------------------+

Cascadia Megathrust Event (Updated Structural Model):
| Shaking Duration: ~300 to 420 seconds (5 to 7 minutes)
| Load Cycles: 80 to 150+ inelastic degradation cycles
| Energy Release: Extended duration, basin wave trapping, +9% to +17% PGA
+----------------------------------------------------------------------------+
Under 80 to 150+ load reversals generated by an extended Cascadia rupture, reinforced concrete structures experience significant strength degradation:
+-----------------------------------------------------------------------------------+
|                        STRUCTURAL DEGRADATION MECHANICS                           |
+-----------------------+-----------------------------------------------------------+
| Core Concrete Spalling| Concrete within column and wall cores crushes under       |
|                       | sustained cyclic compression.                             |
+-----------------------+-----------------------------------------------------------+
| Rebar Buckling        | Longitudinally embedded steel rebar undergoes low-cycle   |
|                       | fatigue, plastic deformation, and ductile necking.        |
+-----------------------+-----------------------------------------------------------+
| Bond Slip & Pull-Out  | Repeated load reversals strip adhesive bonding between    |
|                       | structural concrete and internal steel rebar matrices.    |
+-----------------------+-----------------------------------------------------------+
| Shear Wall Hinging    | Plastic hinges at building bases degrade, shifting the    |
|                       | building's natural period into resonance with basin waves.|
+-----------------------+-----------------------------------------------------------+
Research from the University of Washington and the M9 Project indicates that the collapse risk for modern tall reinforced concrete shear wall buildings located inside sedimentary basins is higher than initial design targets.
When high-rise buildings (between 10 and 40 stories) experience stiffness degradation, their fundamental period lengthens. If this softened period aligns with the 1.0- to 3.0-second resonant periods trapped inside the Tillamook, Tualatin, or Seattle basins, the structure enters harmonic resonance, causing severe inter-story drift and potential structural collapse.
+-----------------------------------------------------------------------------------+
|            REGIONAL INFRASTRUCTURE IMPACT AND LOSS METRICS (DOGAMI / FEMA)       |
+------------------------------------+----------------------------------------------+
| Metric Category                    | Projected Impact Estimate                    |
+------------------------------------+----------------------------------------------+
| Direct Building Repair Costs       | $27 Billion to $43 Billion (5-county OR zone)|
| Building Value Loss Percentage     | 9% to 14% total structural replacement cost  |
| Regional Casualty Projections      | 5,300 to 33,000 individuals (Time dependent) |
| Displaced Population / Sheltering  | 24,000 to 116,000 residents requiring shelter|
| Highway Bridge Critical Failures   | >1,000 bridges structurally compromised      |
| Critical Energy Infrastructure Hub | High risk of tank rupture / Willamette river |
| (CEI Hub, Portland)                | liquefaction along a 6-mile industrial strip |
+------------------------------------+----------------------------------------------+
Seismic Microzonation: Basin Geometry and Deep Shear Profiles
The identification of the Tillamook basin highlights the need for seismic microzonation across the Pacific Northwest.
Seismic hazards cannot be accurately modeled using a single uniform shaking value across large regions. The local geotechnical profile—specifically the time-averaged shear-wave velocity in the upper 30 meters of soil and rock ($V_{s30}$), along with the depth to the 1.0 km/s and 2.5 km/s shear-velocity horizons ($Z_{1.0}$ and $Z_{2.5}$)—heavily dictates the final shaking intensity at the surface.
+-----------------------------------------------------------------------------------+
|               SITE CLASSIFICATION MATRIX AND LOCAL SOIL EFFECTS                   |
+------------+--------------------+-----------------------+-------------------------+
| NEHRP Soil | Soil Profile       | Average Shear Wave    | Ground Motion           |
| Class      | Description        | Velocity ($V_{s30}$)  | Amplification Ratio     |
+------------+--------------------+-----------------------+-------------------------+
| Class A    | Hard Igneous Rock  | > 1,500 m/s           | 0.8x (De-amplification) |
+------------+--------------------+-----------------------+-------------------------+
| Class B    | Competent Bedrock  | 760 to 1,500 m/s      | 1.0x (Baseline reference|
+------------+--------------------+-----------------------+-------------------------+
| Class C    | Very Dense Soil /  | 360 to 760 m/s        | 1.2x to 1.5x moderate   |
|            | Soft Rock          |                       | amplification           |
+------------+--------------------+-----------------------+-------------------------+
| Class D    | Stiff Soils        | 180 to 360 m/s        | 1.6x to 2.4x strong     |
|            | (Glacial till/clay)|                       | amplification           |
+------------+--------------------+-----------------------+-------------------------+
| Class E    | Soft Clay / Loose  | < 180 m/s             | 2.5x to 3.8x extreme    |
|            | Alluvium           |                       | amplification / liquefy |
+------------+--------------------+-----------------------+-------------------------+
| Class F    | Liquefiable Soils  | Site-specific         | High lateral spreading  |
|            | (River Estuaries)  | analysis mandatory    | & catastrophic failure  |
+------------+--------------------+-----------------------+-------------------------+
In coastal estuaries, alluvial river valleys, and reclaimed land (NEHRP Site Classes E and F), unconsolidated, water-saturated silt and sand lose all shear strength under sustained dynamic cyclic loading. This triggers widespread soil liquefaction.
MECHANICS OF SOIL LIQUEFACTION UNDER CYCLIC SHEAR:

   Static Soil State               Dynamic Cyclic Loading          Liquefied State
   +-------------------+           +-------------------+           +-------------------+
   | O   O   O   O   O |           | ~ ~ ~ ~ ~ ~ ~ ~ ~ |           | ~ ~ ~ ~ ~ ~ ~ ~ ~ |
   |   O   O   O   O   |  ====>    |   O ~ O ~ O ~ O   |  ====>    |  O   O   O   O    |
   | O   O   O   O   O |           | ~ O ~ O ~ O ~ O ~ |           |    O   O   O   O  |
   +-------------------+           +-------------------+           +-------------------+
    Pore water pressure             Pore pressure spikes;           Soil loses shear
    stable; grain contact           grain contacts broken           strength; structures
    maintains load capacity.        by cyclic shear waves.          sink and tilt.
When excess pore water pressure ($u_e$) matches the initial effective overburden stress ($\sigma'_v$), the soil behaves as a dense liquid:
$$r_u = \frac{u_e}{\sigma'_v} = 1.0$$
Under these conditions, bridge abutments spread laterally toward river channels, buried utility pipelines fracture, and heavy structural foundations settle and tilt.
The discovery that the seismogenic interface is five kilometers shallower means that critical seismic energy reaches liquefaction-prone soils with less prior attenuation, accelerating the onset of soil liquefaction across coastal zones.
Translating Geophysical Data Into Engineering Codes
The shift from 1980s structural assumptions to high-resolution active-source seismic datasets forces significant updates across structural engineering, emergency logistics, and building codes.
+-----------------------------------------------------------------------------------+
|               UPCOMING ENGINEERING, SEISMIC, AND POLICY MILESTONES                |
+-------------------+---------------------------------------------------------------+
| Timeline          | Agency / Engineering Milestone Objective                      |
+-------------------+---------------------------------------------------------------+
| Ongoing – 2026    | USGS National Seismic Hazard Model (NSHM) revisions incorporating|
|                   | CASIE21 slab geometry and 20 km depth interface contours.      |
+-------------------+---------------------------------------------------------------+
| 2026 – 2027       | Integration of Tillamook and Tualatin basin depth terms       |
|                   | ($Z_{1.0}, Z_{2.5}$) into ASCE 7-28 building design standards.|
+-------------------+---------------------------------------------------------------+
| Next-Generation   | Deployment of expanded buried Ocean Bottom Seismometer (OBS)  |
| Array Fieldwork   | networks along central Cascadia to track shallow slip tremor. |
+-------------------+---------------------------------------------------------------+
| Regional Policy   | Updates to ODOT / WSDOT lifeline highway retrofit targets to  |
| Allocations       | address the +9% to +17% PGA coastal increase.                 |
+-------------------+---------------------------------------------------------------+
The updated USGS fault models directly inform the National Seismic Hazard Model (NSHM), which serves as the foundational data source for the American Society of Civil Engineers (ASCE 7) Standard and the International Building Code (IBC).
Incorporating a 5-kilometer shallower slab depth off northern Oregon, combined with explicit basin amplification terms ($Z_{1.0}$ and $Z_{2.5}$), will raise the design Base Shear ($V_b$) calculations for future construction throughout the I-5 corridor and coastal communities:
$$V_b = C_s \cdot W = \frac{S_{DS}}{\left(\frac{R}{I_e}\right)} \cdot W$$
Where:
- $C_s$ is the seismic response coefficient,
- $S_{DS}$ is the design spectral response acceleration parameter,
- $W$ is the effective seismic weight of the structure,
- $R$ is the response modification factor,
- $I_e$ is the importance factor.
With $S_{DS}$ values scaling upward due to increased peak ground acceleration and basin amplification adjustments, the lateral strength and ductility capacity of new construction must be engineered to withstand higher dynamic loads.
                STRUCTURAL LOAD ESCALATION CHAIN

  CASIE21 / Nodal Seismic Data
  (Fault 5 km Shallower + Basin Mapped)
             |
             v
  USGS National Seismic Hazard Models (NSHM)
  (+9% to +17% Peak Ground Acceleration along Coast)
             |
             v
  ASCE 7-28 & International Building Code (IBC)
  (Higher Spectral Response Coefficients: S_DS)
             |
             v
  Structural Engineering Designs
  (Increased Base Shear V_b, Heavy Rebar Confinement, Ductile Detailing)
Geoscientists are deploying additional nodal seismometer arrays eastward across the Tualatin Basin to evaluate ground-motion amplification risks for the Portland metropolitan area. Offshore, researchers are deploying arrays of buried Ocean Bottom Seismometers (OBS) near the deformation front to monitor slow slip events and tectonic tremor at the shallow plate boundary.
The revised geometry of the Cascadia subduction zone establishes that the seismic engine driving the Pacific Northwest’s megathrust earthquakes is closer to populated areas, releases energy across distinct structural segments, and generates higher shaking accelerations than previously recognized.
Every millimeter of crustal shortening accumulated each year along this locked plate boundary continues to load a fault now confirmed to sit just 20 kilometers below the surface. Future hazard preparedness, structural design standards, and coastal defense strategies must now account for these revised geophysical parameters.
Reference:
- https://scitechdaily.com/hidden-earthquake-threat-oregons-fault-may-be-closer-to-the-surface-than-scientists-thought/
- https://www.futura-sciences.com/en/this-giant-fault-beneath-the-ocean-could-trigger-the-next-big-one_26346/
- https://www.bioscience.com.pk/en/subject/earth-science/scientists-found-a-missing-piece-of-the-cascadia-earthquake-puzzle-deep-beneath-the-pacific-northwest
- https://www.seismosoc.org/news/new-look-on-subducting-plate-near-oregon-coast-suggests-increased-shaking-during-megaquake/
- https://en.wikipedia.org/wiki/Cascadia_subduction_zone
- https://co.lincoln.or.us/DocumentCenter/View/2161
- https://cascadiamovement.org/directory/in-the-news/
- https://www.facebook.com/thelostatlas.official/videos/for-more-than-300-years-the-pacific-northwest-has-been-living-beside-a-sleeping-/1733738374506360/
- https://www.earthscope.org/event/imaging-the-cascadia-subduction-zone-with-marine-active-source-seismic-data/
- https://news.climate.columbia.edu/2024/06/08/cascadia-subduction-zone-one-of-earths-top-hazards-comes-into-sharper-focus/
- https://www.nsf.gov/news/deeper-look-where-really-big-one-could-occur
- https://pmc.ncbi.nlm.nih.gov/articles/PMC11160458/
- https://www.researchgate.net/publication/381254662_Subducting_plate_structure_and_megathrust_morphology_from_deep_seismic_imaging_linked_to_earthquake_rupture_segmentation_at_Cascadia
- https://www.sciencedaily.com/releases/2026/08/260828082350.htm
- https://dailygalaxy.com/2026/07/vancouver-island-subduction-zone-ocean-floor-drop-cascadia-fault/
- https://news.ssbcrack.com/shallower-juan-de-fuca-plate-beneath-oregon-may-increase-earthquake-risk/
- https://rosap.ntl.bts.gov/view/dot/31665/dot_31665_DS1.pdf
- https://survivingcascadia.com/estimated-impacts-shaking-intensity/
- https://survivingcascadia.com/estimated-impacts-shaking-intensity/
- https://efiling.energy.ca.gov/GetDocument.aspx?tn=61562
- https://www.osti.gov/servlets/purl/2586806
- https://www.sciencedaily.com/releases/2026/08/260828082350.htm
- https://seismica.library.mcgill.ca/article/view/1540
- https://www.techno-science.net/en/news/a-mega-earthquake-coming-to-the-united-states-where-it-was-least-expected-28840