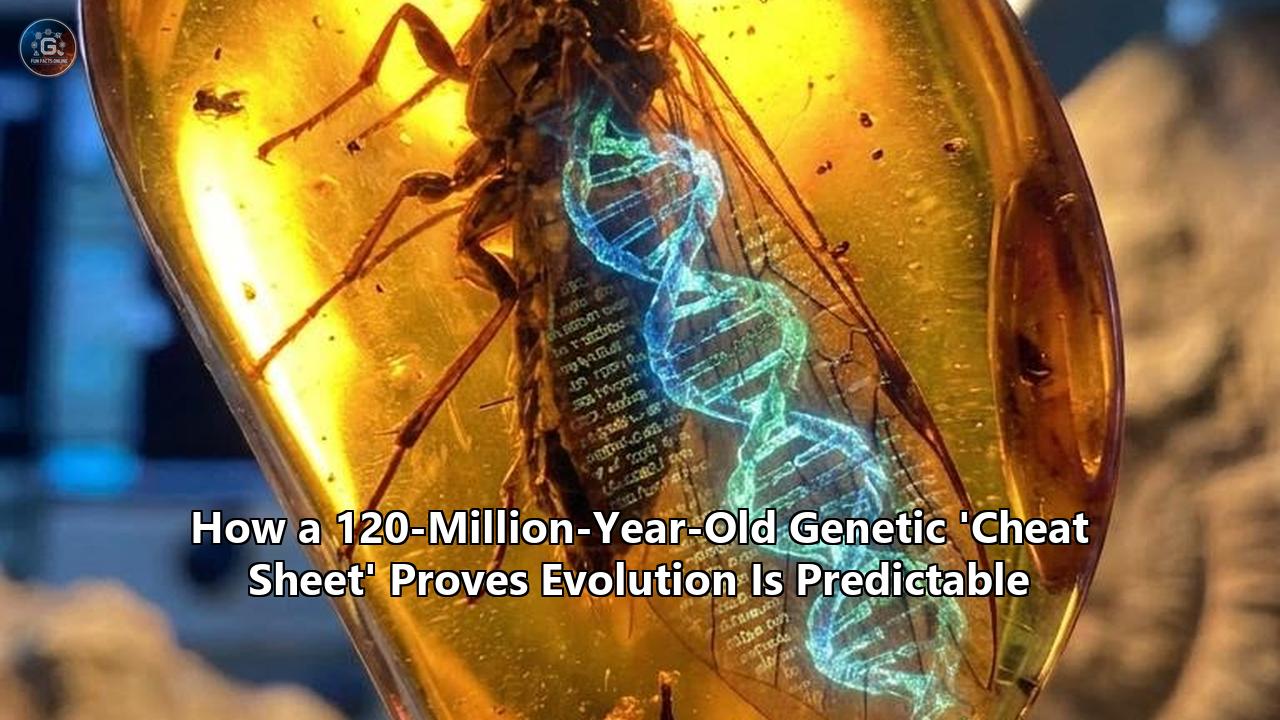
On April 30, 2026, a international research collaboration led by the University of York and the Wellcome Sanger Institute published a study in PLOS Biology that fundamentally upends the classical, open-ended view of evolutionary theory. By analyzing the genomes of eight highly divergent lepidopteran species that split from a common ancestor up to 120 million years ago—during the early Cretaceous period when dinosaurs dominated the terrestrial landscape—researchers discovered that vastly different species rely on the exact same genetic "cheat sheet" to adapt to selective pressures.
Rather than traversing an infinite landscape of biological possibilities, nature repeatedly returns to the same molecular coordinates. This physical reality establishes that genetic evolution predictability is not a theoretical ideal, but a mathematically quantifiable property of life.
Using a combination of high-throughput genome-wide association studies (GWAS), quantitative trait locus (QTL) mapping, and CRISPR-Cas9 genome editing, the scientific team—including lead author Dr. Yacine Ben Chehida and co-first author Dr. Eva S. M. van der Heijden—mapped the precise genomic mechanics behind wing color pattern mimicry in South American rainforests. The study settled a century-old biological debate. It proved that despite 120 million years of independent genetic drift, butterflies and a day-flying moth repeatedly manipulate a single pair of genes—ivory and optix—to develop identical, toxic-warning color patterns.
The precision of this convergence is staggering: evolutionary changes do not occur randomly throughout the genome, nor even within the protein-coding sequences of these genes. Instead, they are localized to identical, narrow noncoding regulatory windows measuring only a few hundred base pairs in length.
               [ Cretaceous Common Ancestor ] (~120 Million Years Ago)
                             │
            ┌────────────────┴────────────────┐
            ▼                                 ▼
   [ Ithomiini Butterflies ]         [ Chetone histrio Moth ]
    (Diverged ~30 Mya)               (Diverged ~120 Mya)
            │                                 │
     Independent                       Independent
    Parallel Mutations               Chromosomal Inversion
    in first intron of                of ~1.018 Megabases
    `ivory` (25k-33k bp              containing `ivory`
    downstream of promoter)                   │
            │                                 │
            └───────────────┬─────────────────┘
                            ▼
               [ Convergent Warning Pattern ]
                    (Tiger Mimicry Ring)
Quantifying the Neotropical Tiger Mimicry Ring
The natural laboratory for this study is the neotropical "tiger" mimicry ring of South America. This species-rich ecological network contains over 100 chemically defended insect species spanning five distinct lepidopteran families. These organisms converge on near-identical wing color patterns—bold stripes of orange, black, and yellow—to warn avian predators of their unpalatability, a survival strategy known as Müllerian mimicry.
To understand the mathematical dynamics driving this convergence, one must look at the selective coefficients of predator learning. When an avian predator encounters a toxic insect, it registers the visual pattern as a chemical warning. The probability of any individual insect being attacked by a naive predator is inversely proportional to the density of co-mimics in the local environment:
$$P_{\text{attack}} \propto \frac{1}{N}$$
Where $N$ represents the total number of individuals sharing that identical visual signature.
For a newly mutated species or a divergent lineage entering a habitat, matching the prevailing "tiger" template yields an immediate and massive fitness benefit. This strong, continuous selective pressure forces disparate lineages toward a shared phenotypic optimum.
┌─────────────────────────────────────────────────────────────┐
│                 METRICS OF THE 2026 STUDY                   │
├───────────────────────────────┬─────────────────────────────┤
│ Divergence Timespan           │ Up to 120,000,000 Years     │
├───────────────────────────────┼─────────────────────────────┤
│ Whole Genomes Sequenced       │ 285 Wild-Caught Individuals │
├───────────────────────────────┼─────────────────────────────┤
│ Primary Control Genes         │ 2 (ivory and optix)         │
├───────────────────────────────┼─────────────────────────────┤
│ Moth Chromosomal Inversion    │ 1.018 Megabases (Mb)        │
├───────────────────────────────┼─────────────────────────────┤
│ Butterfly Regulatory Windows  │ 1,155 to 2,140 Base Pairs   │
└───────────────────────────────┴─────────────────────────────┘
The international team gathered genomic data across several genera within this mimicry ring to determine if this visual uniformity was built on a chaotic, highly diverse genetic foundation or a rigidly constrained pathway. The researchers generated whole-genome sequence data from 285 wild-caught individuals across four major ithomiine butterfly species that diverged up to 28 million years ago:
- Melinaea mothone (49 specimens)
- Melinaea menophilus (64 specimens)
- Mechanitis messenoides (111 specimens)
- Hypothyris anastasia (61 specimens)
They also integrated genomic sequences from the day-flying pericopine moth Chetone histrio and various Heliconius butterfly lineages, stretching the evolutionary timeline to 120 million years. This dataset represents one of the most comprehensive genomic cross-sections of a mimicry complex ever assembled, allowing scientists to evaluate the genomic footprint of natural selection across deep geological time.
High-Resolution Genomics: Mapping the Core Loci
By running genome-wide association studies (GWAS) on the 285 wild-caught ithomiine specimens, researchers isolated the precise genetic variants associated with the presence or absence of the highly prominent forewing yellow band. Utilizing squared Spearman's rank correlation coefficients ($\rho^2$) plotted against a strict Bonferroni-corrected significance threshold, the team identified sharp, high-confidence association peaks.
GWAS Association Peak (ρ²)
▲
│            |  <- Narrow peak containing associated SNPs (1,155 - 2,140 bp)
│            |
│           / \
│          /   \
│_________/     \__________________ Bonferroni Threshold (Orange Dashed Line)
│        /       \
│_______/         \________________
└───────────────────────────────────► Genomic Coordinates of `ivory`
Rather than finding thousands of small-effect single-nucleotide polymorphisms (SNPs) scattered across the entire genome, the statistical signals clustered in incredibly narrow intervals. In three of the four primary ithomiine species (Melinaea mothone, Mechanitis messenoides, and Hypothyris anastasia), the fully associated SNPs were confined to genomic windows of just 1,155 to 2,140 base pairs. Even in Melinaea menophilus, which exhibited a slightly broader signal, the entire association peak was limited to 7,373 base pairs.
When these coordinates were aligned to reference assemblies, they mapped directly to the same exact genomic region in every single species: the first intron of a long noncoding RNA (lncRNA) transcript named ivory.
The spatial alignment of these association peaks was remarkably consistent across species that had been breeding independently for tens of millions of years:
- The associated noncoding variants were consistently located between 25,800 and 33,500 base pairs downstream of the ivory transcription start site (TSS).
- This interval sits immediately upstream of a highly conserved cis-regulatory element named E230.
- E230 is a ancient genomic region first identified as a major regulatory switch for wing coloration in the buckeye butterfly, Junonia coenia, indicating its deep developmental heritage across the entire Lepidopteran tree of life.
This high-resolution mapping shows that the genetic architecture of adaptation is highly localized. A complex visual trait like a yellow wing band does not rely on a wholesale restructuring of the genome. Instead, it is governed by highly concentrated mutations occurring in nearly identical, noncoding regulatory coordinates.
The Biochemistry of ivory and optix
The identification of ivory and optix as the master regulators of these convergent patterns highlights a major update in developmental genetics. For nearly two decades, evolutionary biologists believed that the protein-coding gene cortex—which is located in the same genomic neighborhood as ivory—was the primary driver of melanic wing variations in butterflies and moths, including the famous industrial melanism of the peppered moth (Biston betularia).
However, functional and genomic analyses in late 2024 and early 2025 conclusively demonstrated that cortex is not the effector. Instead, the true driver is the adjacent noncoding locus ivory:mir-193.
The ivory:mir-193 Locus:
┌─────────────────────────[ ivory lncRNA ]─────────────────────────┐
│  [ Promoter ] ... [ First Intron (25k-33k bp) ] ... [ mir-193 ]  │
└─────────────────────────────────────────────────────────┬────────┘
                                                          ▼
                                                    [ mir-193 miRNA ]
                                                          │
                                                (Directly Represses)
                                                          ▼
                                                   [ ebony mRNA ]
                                                          │
                                                   (Leads to)
                                                          ▼
                                                    [ Melanism ]
The ivory transcript functions as a gigantic primary long noncoding RNA that contains two deeply conserved microRNAs (miRNAs) within its sequence: mir-193 and mir-2788. When ivory is transcribed, it undergoes co-transcriptional processing to release mature mir-193. This tiny, noncoding RNA molecule then acts in trans, binding directly to target messenger RNAs (mRNAs) in the cytoplasm to repress their translation.
The primary target of mir-193 is ebony, a key gene in the insect melanin biosynthesis pathway. The enzymatic role of Ebony is to convert dopamine into $N$-beta-alanyldopamine (NBAD), which produces a light yellow or tan pigment.
Under normal developmental conditions:
- When mir-193 is highly expressed, it binds to conserved sites in the 3' untranslated region (UTR) of ebony transcripts.
- This binding represses ebony translation.
- Dopamine is shunted toward the production of dark, insoluble eumelanin and pheomelanin pigments.
- This results in deep black or dark brown scales on the butterfly wing.
Conversely, when a mutation occurs in the first intron of ivory (specifically within the 25,800 to 33,500 bp regulatory window), the spatial expression of the lncRNA is disrupted. On the wing regions where ivory is turned off, ebony is de-repressed, shunting dopamine away from the melanin pathway to produce a bright yellow wing band.
The second master gene, optix, is a homeobox transcription factor that acts as a master regulator for red, orange, and brown ommochrome pigments. While ivory:mir-193 acts as a negative regulator of light coloration (promoting black by repressing yellow/tan pathways), optix coordinates the precise spatial deposition of rich orange and red pigments across the wing scales.
Why does evolution target these two specific genes across 120 million years of divergence instead of utilizing any of the dozens of other enzymes in the pigment pathway? The answer lies in the concept of developmental pleiotropy.
Both optix and the enzymes of the melanin pathway have essential, multi-organ roles during development. For instance, the complete knockout of the cortex gene or other core enzymes can cause severe developmental defects, wing structural failure, flightlessness, or lethality.
However, because ivory and optix feature highly modular cis-regulatory elements (CREs), natural selection can alter a single "switch" that controls expression only in a specific subset of wing scale cells during late pupation. This allows the insect to radically alter its visual phenotype to match a local toxic model without causing any negative side effects in other tissues or organs. This modular regulatory architecture makes these two loci the ultimate "evolutionary sweet spots," drastically narrowing the genetic paths to adaptation and enhancing genetic evolution predictability.
The 1.018 Megabase Inversion: A Structural Mirror
The most striking demonstration of evolutionary predictability in the 2026 study comes from the pericopine moth, Chetone histrio. While butterflies of the Ithomiini tribe and the genus Heliconius are closely related within the superfamily Papilionoidea, Chetone histrio belongs to the family Erebidae. The evolutionary lineages of this day-flying moth and the butterflies diverged approximately 120 million years ago, a deep-time separation comparable to that between humans and armadillos.
Unlike the ithomiine butterflies, which display fixed warning patterns across geographically isolated subspecies, C. histrio maintains a local, color-pattern polymorphism in the rainforests of Peru. Individual moths living in the same forest belong to either a "striped" morph (Chetone histrio histrio) or an "orange-black" morph (Chetone histrio hydra) to match different co-occurring butterfly models.
Polymorphism in Chetone histrio:
                       [ Chetone histrio ]
                                │
        ┌───────────────────────┴───────────────────────┐
        ▼                                               ▼
[ Striped Morph ]                               [ Orange-Black Morph ]
- Ancestral Gene Order                          - Derived Inversion (1.018 Mb)
- Recombination Active                          - Recombination Suppressed
- Normal ivory/optix expression                 - Co-adapted Haplotype Locked
When researchers ran a GWAS comparing the genomes of these two moth morphs, they did not find a narrow, single-nucleotide association peak. Instead, they uncovered a massive, flat block of single-nucleotide polymorphisms (SNPs) in perfect association with the color phenotype, spanning exactly 1.018 Megabases (1,018,000 base pairs) of DNA.
By analyzing Illumina mate-pair sequencing read orientations and mapped insert sizes, the team confirmed that this 1.018 Mb block is a massive chromosomal inversion—a structural variant where a large segment of the chromosome has been sliced, flipped 180 degrees, and reinserted.
This 1.018 Mb inversion contains the ivory locus and several flanking genes. In the striped morph, the chromosome retains its ancestral gene order. In the orange-black morph, the chromosome contains the derived inversion, which is inherited as a dominant Mendelian supergene.
The predictability of this structure is highlighted by its close alignment with a well-known genetic system in butterflies:
- The polymorphic butterfly Heliconius numata uses a ~400 kilobase (kb) chromosomal inversion (the P1 inversion) on chromosome 15 to control its complex mimicry polymorphisms.
- This butterfly inversion also contains the ivory locus.
- When aligned, one breakpoint of the 1.018 Mb moth inversion lands almost exactly at the same genomic coordinate as the P1 inversion breakpoint in H. numata.
- The second breakpoint of the moth inversion lies within exactly 8 genes of the corresponding H. numata breakpoint.
A moth and a butterfly, separated by 120 million years of independent evolution, both utilized a large-scale chromosomal inversion at the exact same genetic locus to maintain a complex mimicry polymorphism. In both cases, the inversion acts as a "recombination suppressor". By physically preventing crossing-over during meiosis, the inversion locks together a specific, co-adapted suite of regulatory variants, ensuring they are inherited as a single, multi-trait "supergene".
This structural parallelism shows that evolutionary predictability is not limited to point mutations in single-nucleotide switches; it extends all the way to large-scale chromosomal rearrangements and structural genomic architecture.
Deconstructing the Myth of Hybridization
In evolutionary genomics, finding identical genetic variants in different species is often attributed to hybridization and adaptive introgression. In the genus Heliconius, closely related species frequently interbreed in the wild. This allows them to transfer warning color alleles directly across species boundaries. Under this scenario, a shared genetic mechanism is not a sign of independent convergence, but simply a case of "borrowing" pre-existing genetic solutions.
            ┌──────────────────────────────────────────────┐
            │       GENETIC CONVERGENCE MECHANISMS         │
            ├──────────────────────┬───────────────────────┤
            │  Adaptive            │  Parallel Evolution   │
            │  Introgression       │  (Independent)        │
            ├──────────────────────┼───────────────────────┤
            │ Species interbreed   │ Species evolve        │
            │ to share pre-adapted │ identical mutations   │
            │ genetic alleles.     │ completely on their   │
            │                      │ own over time.        │
            ├──────────────────────┼───────────────────────┤
            │ Common in closely    │ Confirmed in the 2026 │
            │ related Heliconius.  │ Ithomiini study.      │
            └──────────────────────┴───────────────────────┘
To test if hybridization explained the convergence within the Ithomiini tribe, the research team performed two high-resolution quantitative tests:
- Twisst (Topology Weighting by Iterative Sequence Subtree Trios), which evaluates the local phylogenetic relationships of small genomic windows to detect discordant histories indicative of gene flow.
- Relate, a software package that reconstructs local gene genealogies and estimates the age of shared mutations to pinpoint exactly when and where alleles arose.
The results were clear: despite detecting ongoing, low-level hybridization across the rest of the genome in several ithomiine genera, the researchers found no evidence of gene flow or allele sharing at the ivory and optix loci.
The local genealogies reconstructed by Relate revealed that the mutations controlling the yellow forewing band and the melanic hindwing patterns were highly lineage-specific. The variants arose independently in each genus through separate mutational events.
This quantitative evidence settles a major evolutionary question. It demonstrates that the reuse of the ivory and optix genes is driven by deep developmental constraints rather than interspecific gene sharing. Even when species are completely isolated reproductively, they are independently forced toward the exact same molecular solutions.
The Mathematical Limits of Biology
To fully appreciate how these discoveries define genetic evolution predictability, we can model the mathematical probability of these events occurring by chance.
Consider a typical lepidopteran genome, such as that of Mechanitis messenoides:
- The haploid genome size is approximately 350 Megabases (350,000,000 base pairs).
- The genome encodes roughly 15,000 to 20,000 distinct genes.
- Within this genome, there are approximately 1.2 million potential noncoding regulatory regions capable of hosting cis-regulatory elements.
If natural selection had an open-ended, unconstrained path to modify wing coloration, any number of combinations among these 15,000+ genes could be targeted. A change in a yellow band could involve mutations in any of the structural enzymes of the pterin or ommochrome pathways, or in any of the hundreds of transcription factors expressed during wing development.
If we assume a simplified, null model where any of the 15,000 genes has an equal probability of being recruited to control a warning color change, the probability ($P$) of any two independently evolving lineages choosing the exact same two genes (ivory and optix) by pure chance is:
$$P \approx \left(\frac{2}{15,000}\right) \times \left(\frac{1}{14,999}\right) \approx 8.89 \times 10^{-9}$$
When we expand this null model across the eight highly divergent lineages studied (seven butterfly lineages and one moth), the probability of this parallel gene reuse occurring without strict biological constraints becomes astronomically small:
$$P \approx \left(8.89 \times 10^{-9}\right)^{7} \approx 4.19 \times 10^{-57}$$
This statistical reality proves that evolution is not a completely open-ended process. Rather than a chaotic, infinite space of possibilities, the biological search space is funneled through a very narrow corridor.
This funneling is driven by two main physical and developmental constraints:
[ Selective Pressure: Predator Avoidance ]
                     │
                     ▼
       ┌──────────────────────────┐
       │ PHYSICAL CONSTRAINTS     │
       │                          │
       │ 1. Cellular Viability    │
       │    (Non-lethal mutations)│
       │                          │
       │ 2. Regulatory Modularity │
       │    (Tissue-specific,     │
       │    cis-regulatory CREs)  │
       └─────────────┬────────────┘
                     │
                     ▼
[ Evolutionary Outcome: Conserved ivory/optix Reuse ]- Cellular Viability: Mutations in core protein-coding sequences are often highly pleiotropic and harmful to the organism. The cell type differentiation of wing scales represents a highly delicate developmental process where mistakes are lethal.
- Regulatory Modularity: The cis-regulatory architecture of the ivory and optix loci allows for tissue-specific changes with zero negative side effects on the rest of the organism.
Consequently, the physical reality of the cell restricts the genetic options. When a lineage faces selection for visual mimicry, it is forced to use the same highly conserved genetic "cheat sheet". This tight restriction makes evolutionary trajectories highly repeatable and predictable.
CRISPR-Cas9: Functional Proof of the Genetic "Cheat Sheet"
The research team did not rely solely on statistical associations and genomic sequence correlations. To definitively prove that ivory and optix are the causal agents of these wing pattern shifts, they performed embryonic CRISPR-Cas9 knockouts in the ithomiine butterfly, Mechanitis messenoides. This experimental work was conducted by Dr. Eva S. M. van der Heijden at Ikiam University in Ecuador, marking a major milestone as the first CRISPR-modified animals produced in the country.
CRISPR-Cas9 Gene Knockouts in Mechanitis messenoides:
┌───────────────────────────────┬───────────────────────────────┐
│     Disrupted Target Gene     │      Phenotypic Outcome       │
├───────────────────────────────┼───────────────────────────────┤
│ ivory (lncRNA)                │ Black & orange scales         │
│                               │ transform to bright yellow    │
├───────────────────────────────┼───────────────────────────────┤
│ optix (transcription factor)  │ Orange scales transform to    │
│                               │ deep melanic black            │
└───────────────────────────────┴───────────────────────────────┘
The resulting mosaic knockouts (mKO) directly confirmed the genomic mapping:
- Disrupting the ivory promoter and first exon caused a complete loss of dark melanic pigment. Scales that would normally develop as deep black or orange were transformed into bright, reflective yellow scales.
- Disrupting optix caused the opposite transformation: orange scales were completely replaced by deep melanic black scales, confirming its role in promoting orange ommochromes while repressing the melanin pathway.
To understand the spatial dynamics of this control, the team performed HCR (hybridization chain reaction) in situ hybridization on day 3 pupal wings—exactly 50 hours post-pupation.
Day 3 Pupal Forewing Staining (HCR in situ hybridization):
┌─────────────────────────────────────────────────────────────┐
│ [=================== ivory Expression ===================] │
│                                                             │
│             [   No Expression (Yellow Band)   ]             │
│                                                             │
│ [=================== ivory Expression ===================] │
└─────────────────────────────────────────────────────────────┘
      ▲                                             ▲
      │                                             │
Melanic scale development                      Yellow scale development
The spatial expression of ivory transcripts directly prefigured the adult wing coloration:
- ivory was highly expressed across almost the entire pupal wing disc, marking the regions destined to become black or orange.
- Crucially, the narrow band destined to become the bright yellow forewing pattern was completely devoid of ivory expression.
This direct functional evidence closed the loop. It proved that the noncoding regulatory SNPs identified in the wild-caught GWAS act as the molecular switches. These switches turn off the ivory transcript in highly localized wing regions, de-repressing the ebony gene and producing the yellow warning band with surgical precision.
Applied Ecology: Modeling Biodiversity in a Changing Climate
The confirmation of high genetic evolution predictability is not just an academic milestone; it provides a valuable toolkit for applied conservation and ecological forecasting. As ecosystems face rapid, human-induced environmental shifts—including temperature spikes, altered humidity, and habitat fragmentation—predicting which species can adapt and which will slide toward extinction is a critical challenge.
Traditional Polygenic Model                   Predictable Locus Model (e.g., ivory)
┌──────────────────────────┐                  ┌──────────────────────────┐
│ Over 1,000 tiny-effect   │                  │ Single major-effect      │
│ SNPs across the genome.  │       vs.        │ hotspot locus with       │
│ Extremely difficult to   │                  │ modular switches.        │
│ model or screen.         │                  │ Easy to screen & monitor.│
└──────────────────────────┘                  └──────────────────────────┘
Historically, predicting evolutionary adaptation was considered nearly impossible because biologists operated under the assumption of the polygenic "infinitesimal model," where traits are controlled by thousands of tiny-effect genetic variants scattered across the entire genome. Under that model, tracking adaptive potential in the wild requires sequencing entire genomes of thousands of individuals, a logistically and financially challenging task.
The 2026 study demonstrates that key survival adaptations—such as warning coloration, which directly impacts predation rates and population viability—rely on a highly conserved, oligogenic architecture dominated by a few major-effect hotspot loci.
This predictability allows conservation geneticists to develop Genomic Vulnerability Indices (GVIs):
- Targeted Genetic Screening: Instead of sequencing entire genomes, researchers can design low-cost, high-throughput PCR or sequence-capture panels targeting the highly conserved regulatory switches of ivory and optix.
- Mapping Standing Variation: By screening threatened wild populations, scientists can directly quantify the frequency of pre-existing adaptive alleles or mutational potential at these specific hotspot loci.
- Modeling Adaptation Rates: Knowing the specific mutation rates and dominance profiles of these loci (e.g., the recessive nature of the yellow band allele, or the dominant nature of the moth chromosomal inversion) allows ecologists to build highly accurate population genetic models. These models can project whether a population can adapt to a shifting predator regime or climate-induced range shift before facing demographic collapse.
If nature repeatedly reaches for the same genetic tools to solve survival challenges, scientists can monitor those specific tools to forecast the future of biodiversity with unprecedented accuracy.
Unresolved Frontiers of Predictability
The discovery of this 120-million-year-old genetic cheat sheet opens up new horizons in evolutionary biology. While the predictability of wing coloration in butterflies and moths is now firmly established, several major questions remain unresolved:
- Physiological and Metabolic Traits: Does this high level of predictability extend to complex physiological and metabolic adaptations, such as insecticide resistance, heavy metal tolerance, or desiccation and heat-stress resistance? Do insects reuse similar noncoding regulatory switches to survive modern pesticide applications?
- The Noncoding Landscape in Vertebrates: While the ivory:mir-193 locus is highly conserved across insects, do vertebrates rely on similar long noncoding RNAs and microRNAs to orchestrate their own convergent adaptations? Are the color patterns of birds, fish, and reptiles governed by similarly constrained noncoding hotspots?
- The Source of Chromosomal Inversions: What molecular mechanisms drive the formation of identical chromosomal inversions in species separated by 120 million years of divergence? Are there specific genomic sequences—such as transposable elements or repetitive DNA regions—that act as structural fragile sites, making inversions highly repeatable and predictable?
The 2026 PLOS Biology study proves that evolution does not always play with a completely blank slate. The next phase of genomic research will map the limits of this predictability across the wider tree of life. By decoding the conserved genetic rules that have guided adaptation since the age of the dinosaurs, scientists are gaining the ability to anticipate how life on Earth will adapt, evolve, and survive in the centuries to come.
Reference:
- https://www.sanger.ac.uk/news_item/evolution-has-reused-the-same-genes-for-120-million-years/
- https://www.popularmechanics.com/science/animals/a71244855/moth-butterfly-parallel-evolution/
- https://scitechdaily.com/scientists-discover-evolutions-120-million-year-old-cheat-sheet/
- https://greekreporter.com/2026/05/01/evolution-reuses-same-genes/
- https://journals.plos.org/plosbiology/article/file?id=10.1371/journal.pbio.3003742&type=printable
- https://bsky.app/profile/did:plc:dpwndus4rqkqtl56ixvern33
- https://journals.plos.org/plosbiology/article?id=10.1371/journal.pbio.3003742
- https://journals.plos.org/plosbiology/article?id=10.1371/journal.pbio.3003742
- https://www.sciencedaily.com/releases/2026/05/260502233856.htm
- https://scientificinquirer.com/2026/05/04/evolution-has-used-the-same-genetic-playbook-for-120-million-years/
- https://www.researchgate.net/publication/290598060_Evolutionary_Novelty_in_a_Butterfly_Wing_Pattern_through_Enhancer_Shuffling
- https://journals.plos.org/plosbiology/article?id=10.1371/image.pbio.v24.i04
- https://www.biorxiv.org/content/10.64898/2026.02.24.707733v1.full-text
- https://www.sciencedaily.com/releases/2024/12/241206111954.htm
- https://www.researchgate.net/publication/378164829_A_micro-RNA_drives_a_100-million-year_adaptive_evolution_of_melanic_patterns_in_butterflies_and_moths
- https://www.biorxiv.org/content/10.64898/2026.02.24.707831v2.full-text
- https://pmc.ncbi.nlm.nih.gov/articles/PMC11042203/
- https://www.the-scientist.com/butterfly-wing-colors-explained-by-microrna-72726
- https://www.mdpi.com/2077-0472/15/9/992
- https://www.biorxiv.org/content/10.64898/2026.02.24.707733v1.full.pdf
- https://www.sanger.ac.uk/news_item/evolution-has-reused-the-same-genes-for-120-million-years/
- https://prelights.biologists.com/highlights/a-long-non-coding-rna-at-the-cortex-locus-controls-adaptive-colouration-in-butterflies-the-ivory-lncrna-regulates-seasonal-color-patterns-in-buckeye-butterflies-a-micro-rna-drives-a-100-million-year-2/
- https://www.researchgate.net/publication/380275146_Optix_regulates_nanomorphology_of_butterfly_scales_primarily_via_its_effects_on_pigmentation
- https://scientificinquirer.com/2026/05/04/evolution-has-used-the-same-genetic-playbook-for-120-million-years/
- https://www.thebrighterside.news/post/evolution-has-used-the-same-genetic-cheat-sheet-for-over-120-million-years/
- https://www.thebrighterside.news/post/evolution-has-used-the-same-genetic-cheat-sheet-for-over-120-million-years/
- https://scienceandculture.com/2026/05/extraordinary-genetic-convergent-evolution-in-moths-and-butterflies/
- https://www.researchgate.net/scientific-contributions/Dominic-Absolon-2249564231
- https://www.thebrighterside.news/post/evolution-has-used-the-same-genetic-cheat-sheet-for-over-120-million-years/
- https://www.researchgate.net/profile/James-Mallet
- https://www.biorxiv.org/content/10.64898/2026.03.23.713665v1.full.pdf
- https://www.youtube.com/shorts/tmlVjy3v1p8
- https://journals.plos.org/plosbiology/article/figures?id=10.1371/journal.pbio.3003742
- https://www.sciencedaily.com/releases/2026/05/260502233856.htm
- https://www.thenews.com.pk/latest/1401334-evolution-is-not-always-random-study-finds-same-gene-reused-for-120-million-years
- https://arxiv.org/pdf/2412.06521