
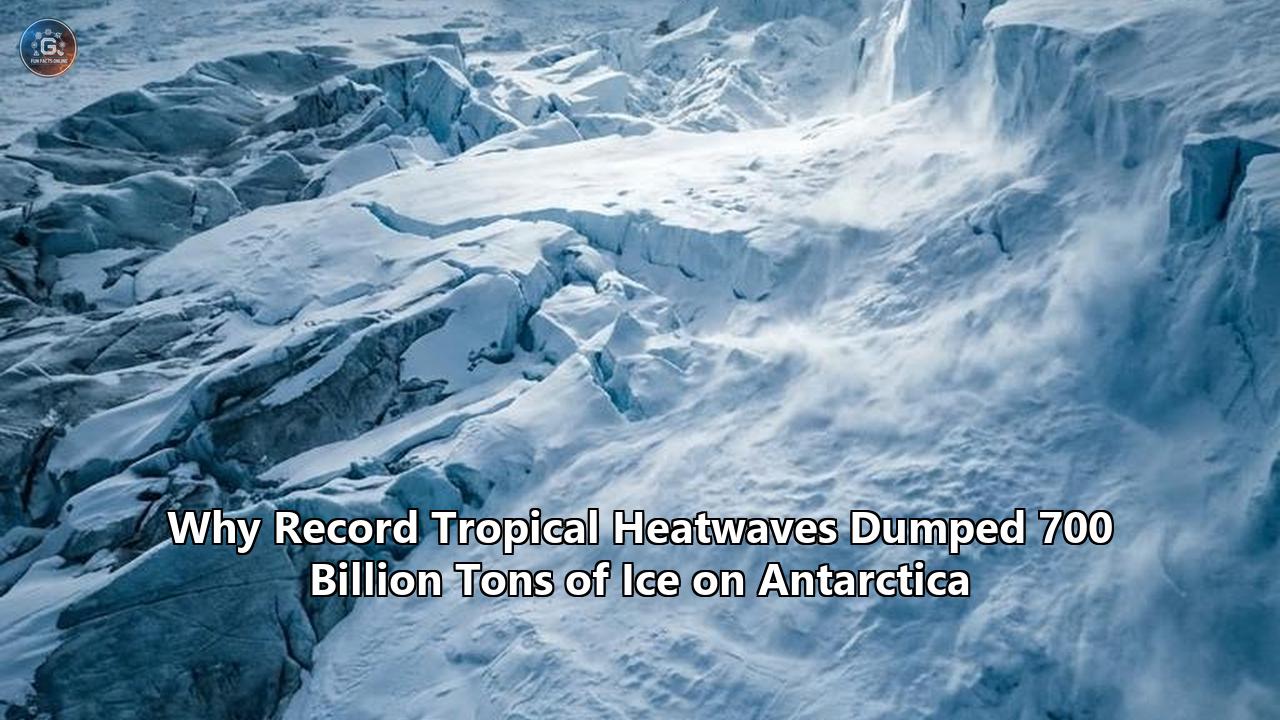
Between July 2021 and April 2023, twin satellites orbiting hundreds of miles above Earth detected a geophysical anomaly that initially left polar researchers rubbing their eyes: the Antarctic Ice Sheet gained roughly 695 billion metric tons of mass in just 22 months.
On a continent that had spent the preceding two decades shedding an average of 140.5 billion tons of ice every year, an accumulation of that scale was staggering. It was the single largest short-term mass surge recorded since satellite gravity monitoring began in 2003. The volume of water locked away in new snow and ice was equal to roughly half of Lake Erie, sufficient to temporarily withhold nearly two millimeters of global sea level rise from the world's oceans.
Predictably, the spike in mass triggered a flurry of headlines and bad-faith speculation, with climate contrarians citing the expansion as evidence that the cryosphere was rebounding. The physical reality, however, pointed in the exact opposite direction.
A study published in Nature led by Dr. Wang Yunhe of the Institute of Oceanology at the Chinese Academy of Sciences (IOCAS), alongside an international team of atmospheric scientists and glaciologists, cracked the mechanism behind the event. The 700-billion-ton ice dump was not the result of polar cooling. Instead, it was catalyzed thousands of miles to the north by unprecedented, multi-year marine heatwaves inside the Indo-Pacific Tropical Warm Pool.
The research reveals an atmospheric connection where equatorial oceanic heat altered high-altitude wind patterns across the Southern Hemisphere, establishing a planetary conveyor belt that sucked moisture out of the mid-latitude Indian Ocean and blasted it directly onto the coastal plateaus of East Antarctica.
While the event delivered a brief surplus to the continent’s surface, it did nothing to halt the deep structural crisis of Antarctica ice melt driven by warming oceans beneath vulnerable ice shelves. To understand how record tropical heat managed to bury a polar desert beneath mountains of snow, one must follow an atmospheric chain reaction stretching from the steamy surface of equatorial seas to the freezing expanses of the Antarctic ice sheet.
The Equator’s Thermal Engine: The Indo-Pacific Warm Pool
The sequence began in the Indo-Pacific Tropical Warm Pool, an oceanic expanse spanning the waters between the eastern Indian Ocean, the Indonesian archipelago, and the western tropical Pacific. This region houses the warmest open-ocean waters on the planet, consistently exceeding 28 degrees Celsius (82.4 degrees Fahrenheit). Because warm water fuels deep atmospheric convection, the Warm Pool operates as the thermodynamic engine room of Earth’s climate system.
Beginning in early 2021 and persisting through early 2023, sea surface temperatures across this basin climbed to sustained anomalies roughly 0.5 degrees Celsius (0.9 degrees Fahrenheit) above the historical baseline. While half a degree Celsius might sound negligible to someone reading an indoor thermometer, across millions of square kilometers of deep tropical ocean, that increment represents an unimaginable accumulation of thermal energy.
Warm water at the surface evaporates rapidly, loading the lower troposphere with moisture. As that saturated air rises, the water vapor condenses into towering storm complexes known as cumulonimbus clouds, releasing massive quantities of latent heat into the middle and upper troposphere.
During the 2021–2023 period, the Indo-Pacific Warm Pool released that latent energy continuously, day after day, for nearly two full years. This was not a standard, fleeting marine heatwave; it was a multi-year thermal reservoir. The persistent updrafts acted like a gigantic piston pumping kinetic energy and thermal pulses straight up into the high-altitude atmosphere.
When energy enters the tropical atmosphere at that scale, it cannot remain localized. It must dissipate. As the rising air hit the tropical tropopause, it spread horizontally toward the poles, running headlong into Earth's rotation and setting off planetary-scale waves across the global circulation.
                 THE ATMOSPHERIC TELECONNECTION CHAIN

  EQUATOR: Indo-Pacific Warm Pool (2021-2023)
  [ Ocean SSTs +0.5°C ] ---> Extreme Convection & Latent Heat Release
                                          │
                                          ▼
  UPPER TROPOSPHERE: Planetary Rossby Wave Train Triggered
  [ High-altitude pressure waves propagate southeastward across Southern Ocean ]
                                          │
                                          ▼
  REGIONAL CIRCULATION: North-South Atmospheric Dipole Established
  [ Deep Low Pressure south of Australia ] <--> [ Blocking High along East Antarctic Coast ]
                                          │
                                          ▼
  MOISTURE TRANSPORT: Sky-River Express
  [ Atmospheric rivers channel Indian Ocean water vapor straight onto Queen Mary/Wilkes Land ]
                                          │
                                          ▼
  OROGRAPHIC DUMP: Massive Coastal Snowfall
  [ +695 Billion Metric Tons of Ice Added in 22 Months ]
Rossby Wave Trains: How the Tropics Talked to the Pole
The physical medium carrying the equator's excess energy to Antarctica was an atmospheric phenomenon known as a Rossby wave train.
Rossby waves, or planetary waves, are natural meanders in high-altitude winds caused by the variation of the Coriolis effect with latitude. When a major geographic heat source—such as the energized Indo-Pacific Warm Pool—disturbs the atmosphere, it functions like an enormous boulder dropped into a swift, broad river. It does not simply create a local splash; it generates a succession of alternating high- and low-pressure ripples that propagate diagonally downstream across thousands of miles.
The mathematical underpinnings of this teleconnection were first mapped by atmospheric dynamicists like Jule Charney and Brian Hoskins, who showed that stationary heat sources in the tropics can force barotropic and baroclinic energy fluxes across the hemispheres. In the Southern Hemisphere, this meant the wave energy launched from the maritime continent of Indonesia traveled southeastward, curving down across the southern Indian Ocean toward high latitudes.
As these wave pulses propagated southward, they entered the roaring mid-latitude westerly jet stream circling Antarctica. Rather than dissipating, the wave train locked into a self-reinforcing feedback loop known as eddy-mean flow interaction. Transient storm eddies in the Southern Ocean transferred momentum into the stationary wave pattern, effectively freezing the meandering high- and low-pressure centers in place.
The downstream end of this planetary wave train terminated directly above the icy rim of East Antarctica. Instead of weather systems sweeping smoothly around the pole from west to east as they normally do, the trapped Rossby wave fundamentally reconfigured the atmospheric architecture above the ice sheet.
The Pressure Trap: Building a North-South Dipole
By late 2021, the anchored Rossby wave had carved out a persistent north-south atmospheric dipole—a pair of interconnected, opposing pressure cells that took up semi-permanent residence between Australia and Antarctica:
- To the north: A deep, persistent low-pressure anomaly formed over the open waters of the Southern Ocean, just south of Australia.
- To the south: A stubborn, massive high-pressure blocking ridge settled directly over the coastal edge of East Antarctica.
In the Southern Hemisphere, air circulates clockwise around low-pressure systems and counterclockwise around high-pressure systems. When you place a deep low directly adjacent to a towering high, their opposing rotational directions do not cancel out. Instead, they mesh together like twin industrial gears.
               THE DIPOLE CIRCULATION "PUMP"

                    [ Southern Ocean ]
                     LOW PRESSURE CELL
                    (Clockwise Rotation)
                             │   ▲
                             │   │
                             ▼   │   <--- Mid-latitude moisture drawn southward
                                 │
                    HIGH PRESSURE CELL
                 (Counterclockwise Rotation)
                    [ Coastal East Antarctica ]
This atmospheric gear system created an unbroken, high-speed wind corridor running directly between the two pressure centers.
Under normal circumstances, the circular polar vortex and the circum-Antarctic westerly winds act like an atmospheric fortress, walling off Antarctica and preventing warm, humid subtropical air from penetrating the frozen interior. But the blocking high-pressure ridge broke the fortress walls wide open.
It stalled normal west-to-east storm tracks, forcing maritime air masses from the southern and mid-latitude Indian Ocean to make a sharp right turn, funneling them straight south toward the East Antarctic coastline.
Rivers in the Sky: Channeling 45% of the Ocean's Evaporation
With the atmospheric pump locked into position, the conduit began pulling vast quantities of moisture into the Antarctic atmosphere via atmospheric rivers.
Atmospheric rivers are long, narrow filaments of intense horizontal water-vapor transport. While they are well-known along the west coasts of North America and Europe—often blamed for catastrophic atmospheric deluges in places like California—they also occur in polar realms. An individual polar atmospheric river can be thousands of kilometers long yet only a few hundred kilometers wide, hauling as much water vapor as the Amazon River carries liquid water.
To identify the precise origins of the Antarctic snowfall surge, Dr. Wang’s team divided the Earth's surface into 54 geographic tracking zones and ran backward water-vapor tracking simulations. Their findings revealed a striking moisture pipeline:
- Under average climatological conditions, moisture evaporating from three specific mid-latitude zones in the southern Indian Ocean accounts for roughly 49% of all precipitation falling on East Antarctica.
- During the 2021–2023 surge, the total evaporation rate over the Indian Ocean did not actually increase. The ocean was not producing more vapor out of nowhere.
- Instead, the dipole circulation re-routed that moisture with mechanical efficiency. The tracking simulations showed that 45% of the excess precipitation dumped onto East Antarctica was directly siphoned from those mid-latitude Indian Ocean sectors.
The dipole did not need the ocean to boil; it simply seized the moisture that would normally have rained out harmlessly over empty ocean expanses and redirected it straight down the throat of the polar continent.
Recent physical observations by atmospheric scientist Kazu Takahashi and his colleagues have shown that atmospheric rivers reaching Antarctica do not travel as vertical walls of vapor, but arrive at tilted, diagonal angles. As these angled rivers of air slammed into the continent, they struck one of the most formidable topographic barriers on Earth: the East Antarctic Ice Sheet, which rises abruptly from the sea into a frozen plateau several miles high.
The Orographic Hammer
When warm, vapor-saturated air masses encounter a steep continental wall, they are forced upward rapidly—a process known as orographic lifting.
As the air ascends the coastal slopes of East Antarctica, atmospheric pressure plummets and the air expands adiabatically, cooling at a rapid physical rate. Because the maximum water-holding capacity of air falls exponentially as temperature drops (governed by the Clausius-Clapeyron relation), the air mass can no longer hold its water vapor.
The moisture desublimates and condenses instantly, producing hyper-intense, sustained blizzard conditions. For nearly two years, consecutive atmospheric river events repeatedly hammered two specific coastal territories: Queen Mary Land and Wilkes Land.
Out of the total 695 billion metric tons gained by the continent, 470.3 billion tons—approximately 68%—accumulated exclusively within this single coastal stretch. Snowfall in Queen Mary Land and Wilkes Land during this 22-month window outpaced long-term averages by 351.2 billion tons. It was an unprecedented blizzard parade, sustained month after month by a tropical heat source pulsing thousands of miles away.
Weighing an Ice Sheet: How GRACE Satellites Caught the Surge
Proving that Antarctica had accumulated 695 billion metric tons of ice was not a matter of sticking rulers into snowdrifts. The logistical impossibility of measuring snow depth across an unpopulated continent 1.4 times the size of the United States means scientists rely on orbital gravimetry.
The measurement came courtesy of the GRACE-FO (Gravity Recovery and Climate Experiment Follow-On) satellite mission, a joint initiative between NASA and the German Research Centre for Geosciences (GFZ).
               HOW GRACE-FO WEIGHS POLAR ICE

     GRACE Sat A                        GRACE Sat B
    [ Satellite ] <===== Laser =====> [ Satellite ]
          │          Ranging Link           │
          │                                 │
          ▼                                 ▼
   ~~~~~~~~~~~~~~~~~~~~~~~~~~~~~~~~~~~~~~~~~~~~~~~~~~~~~
      ▲
     / \   Regional Mass Accumulation (695 Billion Tons)
    /   \  Exerts localized gravitational tug, pulling
   / ICE \ Sat A downward first, altering inter-satellite gap.
  / SHEET \
GRACE-FO does not take photographs, nor does it bounce radar off the ice surface. Instead, it uses two identical spacecraft flying in tandem, separated by about 220 kilometers (137 miles). As the lead satellite flies over an area of Earth with slightly more mass—such as an ice sheet that has just received billions of tons of new snow—the localized gravitational pull accelerates that satellite, pulling it forward and downward slightly. The trailing satellite experiences that same gravitational pull seconds later.
By measuring the microscopic distance fluctuations between the two spacecraft using laser and microwave ranging—detecting changes smaller than one-tenth the width of a human red blood cell—scientists can map regional variations in Earth's gravity field month by month.
Gravimetry is indispensable in glaciology because traditional radar and laser altimeters, which measure surface elevation, can easily be fooled. If fresh snow falls on an ice sheet, it expands the height of the surface, but freshly fallen snow is full of air pockets (low density). It takes decades or centuries for snow to compress into dense firn, and eventually into solid glacial ice. An altimeter might see height, but it cannot differentiate between light, fluffy powder and solid ice.
GRACE-FO measures raw, unadulterated mass. It weighs the continent directly from orbit.
When the GRACE-FO data was processed and corrected for Glacial Isostatic Adjustment (the slow rebound of the solid Earth crust underneath the ice after the last ice age), the signal was unmistakable: between July 2021 and April 2023, the gravity signature over East Antarctica spiked violently upward. The continent had legitimately gained 695 billion tons of water mass.
To verify that this was not a satellite sensor malfunction, Wang’s team cross-checked the data against physical ice cores drilled from coastal glaciers in Queen Mary Land and Wilkes Land. The ice cores, which preserve historical layers of compressed annual snow accumulation like tree rings, showed distinct, thick horizons of high-density snow accumulation corresponding perfectly to the 2021–2023 window. Similar, though smaller, episodic accumulation spikes appeared deeper in the ice cores, confirming that while rare, these atmospheric river injections have precedent.
Dissecting the Blame: Internal Variability vs. Climate Change
The moment a headline announces that Antarctica gained hundreds of billions of tons of ice, it ignites intense debate: Is this evidence of human-induced climate change, or does it disprove it?
Wang’s international research team tackled this question through rigorous climate modeling, comparing observed data against forced and unforced simulations from the Coupled Model Intercomparison Project Phase 6 (CMIP6).
Their findings revealed a subtle, dual reality:
- Internal Climate Variability (Roughly 91%): The atmospheric dipole and the Rossby wave train were overwhelmingly products of natural, unforced decadal climate oscillations. Multi-year warming events inside the Indo-Pacific Warm Pool occur on a recurring quasi-decadal cycle—roughly once every 10 years. A comparable, though less pronounced, atmospheric river surge was recorded in the ice core record around the year 2000. The primary driver of the atmospheric steering mechanism was natural internal variability.
- Anthropogenic Climate Forcing (Roughly 9%): Human greenhouse gas emissions accounted for approximately 9% of the observed snowfall anomaly.
While a 9% contribution might seem modest, its physical meaning is critical. Human-induced warming did not create the atmospheric wave, but it supercharged the moisture-carrying capacity of the air masses caught within it.
Under the Clausius-Clapeyron relation, for every 1.0 degree Celsius that the atmosphere warms, its capacity to hold water vapor increases by roughly 7%. The baseline warming of the global atmosphere and tropical sea surfaces meant that when the dipole conveyor belt activated, the atmospheric rivers carried significantly more vapor than an identical circulation pattern would have carried in the pre-industrial era.
Natural climate variability built the pipe and turned the valve; global greenhouse warming increased the pressure and volume of water running through the hose.
The Mass Balance Equation: Surface Accumulation vs. Basal Melting
To understand why 700 billion tons of snow did not rescue the cryosphere, one must understand the basic accounting equation that governs polar glaciology: Total Mass Balance (TMB) = Surface Mass Balance (SMB) - Dynamic Ice Discharge (D).
                    ANTARCTICA MASS BALANCE DYNAMICS

     SURFACE MASS BALANCE (SMB)               DYNAMIC DISCHARGE (D)
   [ Inland Snow Accumulation ]             [ Submarine Basal Melting ]
                 │                                       │
                 ▼                                       ▼
       (+) Adds mass to ice sheet              (-) Removes mass at ocean edge
                 │                                       │
                 └───────────────┬───────────────────────┘
                                 │
                                 ▼
                    NET ICE SHEET TREND (Negative)
   Long-term basal melt and grounding-line retreat far exceed sporadic snowfall.
The Antarctic Ice Sheet does not gain or lose mass like a frozen puddle on a sidewalk that simply freezes in winter and evaporates in summer. It behaves like an enormous, slow-moving fluid reservoir.
- Mass Gain (SMB): Snowfall is virtually the only way Antarctica gains mass. It does not rain on most of the continent, and moisture cannot condense without precipitation. Snow accumulates inland, compresses into glacial ice over millennia, and slowly flows under its own crushing weight toward the sea.
- Mass Loss (Dynamic Discharge & Basal Melt): Antarctica loses almost none of its ice through surface evaporation or surface melting into rivers. Instead, the massive continental ice sheet flows outward into floating ice shelves—vast, floating platforms of glacial ice that ring the perimeter of the continent, holding back the land-based glaciers behind them like giant structural buttresses.
The fundamental crisis driving Antarctica ice melt today is taking place beneath the surface of the water, not on the surface of the land.
Over the last four decades, shifting circum-Antarctic winds—partly driven by human greenhouse gas emissions and the Antarctic ozone hole—have altered ocean circulation, driving warm, dense water known as Circumpolar Deep Water (CDW) up onto the continental shelf.
This relatively warm ocean water slips underneath the floating ice shelves, melting them from below at their critical grounding lines—the boundary where the glacier detaches from bedrock and begins floating.
As the ice shelves thin and weaken from below, their buttressing capability deteriorates. The land-based glaciers behind them accelerate, sliding down into the ocean at speeds several times faster than their historical averages. Once that grounded ice crosses the grounding line and enters the sea, it immediately displaces water, contributing directly to global sea level rise.
The 2021–2023 accumulation event was purely a Surface Mass Balance (SMB) anomaly. It laid down a massive sheet of snow across the high, stable plateaus of East Antarctica. But that snow did nothing to slow down the warm ocean currents chewing away at the underbelly of West Antarctica’s Thwaites and Pine Island glaciers.
┌────────────────────────────────────────┬────────────────────────────────────────┐
│     EAST ANTARCTICA (The Snow Dump)    │     WEST ANTARCTICA (The Melt Zone)    │
├────────────────────────────────────────┼────────────────────────────────────────┤
│ • Bedrock primarily above sea level    │ • Bedrock sits deep below sea level    │
│ • Thick, terrestrial ice dome          │ • Marine Ice Sheet Instability (MISI)  │
│ • High-altitude, hyper-cold plateau    │ • Vulnerable to warm submarine currents│
│ • 2021–23: Massive snowfall (+470 Gt)  │ • 2021–23: Continued rapid discharge   │
│ • Ice moves sluggishly to coast        │ • Glaciers hemorrhaging mass to sea    │
└────────────────────────────────────────┴────────────────────────────────────────┘
As lead author Wang Yunhe stated upon publication: "This temporary slowdown has not reversed the long-term trend of Antarctic ice-sheet mass loss, and West Antarctica remains the main region of sustained mass loss".
The mathematics of the ice sheet demonstrate why this short-term gain was quickly swallowed by the broader deficit. While East Antarctica was gathering snow, West Antarctica continued its relentless hemorrhage.
Furthermore, as soon as the Indo-Pacific Warm Pool cooled slightly in mid-2023 and the dipole collapsed, the atmospheric river conveyor shut down completely. East Antarctica returned to its baseline status: a bone-dry polar desert that receives only a few centimeters of precipitation a year.
Within months of the conveyor shutting down, the continuous baseline drain of dynamic discharge resumed dominance, and the overall trajectory of the Antarctic Ice Sheet swung straight back into a steep net annual loss.
The Dark Side of Sky Rivers: Heatwaves and Structural Collapse
There is another reason glaciologists view atmospheric rivers with profound apprehension: the very systems that bring life-giving snow can also deliver lethal thermal shocks.
Atmospheric rivers do not carry moisture in a vacuum; they haul tremendous amounts of sensible heat and cloud liquid water. When an atmospheric river makes landfall in Antarctica, it creates a thick, opaque cloud blanket over the ice.
In a typical polar environment, the white snow surface reflects up to 90% of incoming solar radiation back into space, keeping the continent brutally cold. But the warm cloud liquid water within an atmospheric river traps longwave infrared radiation, creating a severe greenhouse effect right at the surface of the ice.
This exact danger materialized in the middle of the 2021–2023 mass gain period.
In mid-March 2022, an atmospheric river of historical magnitude smashed directly into Dome C and Concordia Station on the high East Antarctic Plateau. Concordia Station, located more than 3,200 meters (10,500 feet) above sea level, typically registers temperatures around minus 50 degrees Celsius in mid-March.
During the March 2022 intrusion, the atmospheric river pumped subtropical maritime air straight up onto the plateau, sending temperatures soaring to minus 9.4 degrees Celsius. It was 30 to 40 degrees Celsius (54 to 72 degrees Fahrenheit) above normal—the largest single temperature anomaly ever documented at a meteorological station anywhere on Earth.
               THE DUAL NATURE OF POLAR ATMOSPHERIC RIVERS

                      [ ATMOSPHERIC RIVER ]
                                │
          ┌─────────────────────┴─────────────────────┐
          ▼                                           ▼
   POSITIVE IMPACT                            NEGATIVE IMPACT
  Massive Snow Accumulation                  Severe Surface Heat & Liquid Water
  (+695 Billion Tons of Ice)                 (March 2022 East Antarctic Heatwave)
          │                                           │
          ▼                                           ▼
  Temporarily counterbalances                Trapped longwave radiation induces melt;
  coastal dynamic discharge                  triggers shelf collapse (Conger Ice Shelf)
At the coast, the consequences were catastrophic. The intense atmospheric river, combined with an extratropical cyclone, destabilized the Conger Ice Shelf in East Antarctica. The ice shelf, which had been steadily thinning for years, collapsed entirely into the ocean over the span of a few days.
A companion commentary published in Nature by atmospheric scientist Jonathan Wille pointed out this precarious balance: atmospheric rivers are double-edged swords.
While they supply the only raw material (snow) that can combat Antarctica ice melt, their warming signatures can easily trigger catastrophic surface melting, ice hydrofracturing, and irreversible shelf disintegration.
If future climate conditions increase the frequency and temperature of atmospheric rivers, the warming they carry to the coastal margins could trigger massive surface melting that far outstrips the benefits of any additional snow they deposit inland.
Global Sea Level and the Cost of Misinterpreting Pauses
Between 2003 and 2024, the mass balance of Antarctica translated into a net contribution to global sea levels of roughly 0.4 millimeters per year. While this sounds small, Antarctic ice loss is accelerating exponentially. West Antarctica alone holds enough vulnerable ice to raise global sea levels by more than three meters (10 feet), a scenario that would permanently displace hundreds of millions of people living in coastal cities worldwide.
The 22-month pause from 2021 to 2023 momentarily interrupted that trend. In oceanographic terms, roughly 360 billion metric tons of ice equates to approximately 1 millimeter of global mean sea level. By absorbing 695 billion tons, East Antarctica effectively acted as a sponge, pulling almost 1.9 millimeters of potential sea level rise out of the global ocean and locking it onto the polar plateau.
┌────────────────────────────────────────────────────────────────────────┐
│               THE ARITHMETIC OF GLOBAL SEA LEVEL RISE                  │
├────────────────────────────────────────────────────────────────────────┤
│ • 360 Billion Tons of Ice = ~1.0 mm Global Mean Sea Level              │
│ • Long-term Antarctic baseline loss: ~140.5 Billion Tons/year          │
│ • 2021–2023 Accumulation Event: +695 Billion Tons                      │
│ • Transient sea level offset: ~1.9 mm held on land                     │
│ • Post-2023 state: Rapid baseline loss resumed; sea level rising       │
└────────────────────────────────────────────────────────────────────────┘
For civil engineers, urban planners, and municipal governments along vulnerable coasts—from South Florida and Rotterdam to Jakarta and Shanghai—short-term fluctuations like the 2021–2023 surge present a major communication and policy challenge.
When natural decadal variability temporarily slows down sea level rise, local governments often face political pushback against investing in expensive coastal defenses, seawalls, and managed retreat projects. Siting decisions and long-term capital investments require an understanding that a transient multi-year pause is not a reversal of structural climate risks.
"Understanding how Antarctic ice mass changes helps scientists better project sea-level rise," Wang explained. "More reliable projections can help coastal communities prepare for more frequent flooding and greater storm-surge damage to homes, roads and other infrastructure. That planning needs to account for both the long-term rise in sea level and shorter-term natural climate swings".
The temporary withholding of 1.9 millimeters of sea level was simply an atmospheric loan, borrowed from the tropical ocean and repaid in full the moment the dipole collapsed and dynamic coastal ice loss continued unabated.
Future Trajectory: Monitoring the Polar-Equatorial Circuit
The discovery of the Indo-Pacific Warm Pool teleconnection pathway has permanently shifted how climate scientists view the East Antarctic Ice Sheet.
For decades, the bulk of Antarctic climate modeling focused on the central and eastern Pacific Ocean, looking at how El Niño and La Niña events (the El Niño-Southern Oscillation, or ENSO) influence the Amundsen Sea Low and affect West Antarctica. East Antarctica was long viewed as a sleeping giant: cold, isolated, topographically protected, and largely detached from tropical weather systems.
The findings published by Wang, Ding, and their international co-authors establish that East Antarctica possesses its own dedicated, high-impact conduit to the equator.
               TWO HEMISPHERIC TELECONNECTION PATHWAYS

  1. THE WESTERN ANTARCTIC CONDUIT (Well-Documented)
     Central/Eastern Tropical Pacific (ENSO)
       ---> Amundsen Sea Low
       ---> Drives warm ocean water beneath West Antarctic Ice Shelves

  2. THE EASTERN ANTARCTIC CONDUIT (Newly Uncovered)
     Indo-Pacific Tropical Warm Pool
       ---> Planetary Rossby Wave Train
       ---> North-South Dipole Circulation
       ---> Channeled Atmospheric Rivers dumping snow on Queen Mary/Wilkes Land
Looking forward, polar researchers are focusing on several unresolved scientific fronts:
- Tracking Warm Pool Trends Under Continued Warming: As global greenhouse gas concentrations climb, the Indo-Pacific Warm Pool is warming faster than almost any other open-ocean region. Climate scientists are working to determine whether higher baseline temperatures will lock the warm pool into a permanent state of high-energy convection, or whether the decadal pulsing will become more erratic.
- Mapping the Snowfall vs. Melt Threshold: Glaciologists are deploying new autonomous weather stations across Wilkes Land and Queen Mary Land to pinpoint the exact temperature threshold where incoming atmospheric rivers stop depositing snow and begin triggering widespread coastal rain and surface melting. If the freezing level of these rivers rises just a few hundred meters, future events could accelerate ice shelf collapse rather than building ice sheet mass.
- Refining Next-Generation Gravimetry: NASA and the European Space Agency (ESA) are designing the Mass Change and Geoscience International Constellation (MAGIC), a future satellite mission intended to succeed GRACE-FO. MAGIC will use next-generation quantum gravity sensors and multi-satellite constellations to map small-scale ice mass fluctuations at resolutions ten times sharper than current instruments, allowing glaciologists to watch individual glaciers respond to atmospheric river events in real time.
The 700-billion-ton ice dump of 2021–2023 demonstrates that Earth's climate does not operate in regional silos. A marine heatwave across the coral reefs of Indonesia can redraw high-altitude wind patterns across thousands of miles, steering sky rivers into polar deserts and burying Antarctic glaciers beneath billions of tons of snow.
Yet this extraordinary geophysical event offers no escape from the broader reality of global climate change. Rather than signaling an end to Antarctica ice melt, the transient ice surge revealed just how deeply the remote frozen continent is tied to the overheating tropics—a planetary system where a burst of extreme ocean heat at the equator can reshape the frozen bottom of the world.
Reference:
- https://scitechdaily.com/antarctica-gained-a-record-695-billion-tons-of-ice-in-just-two-years/
- https://www.globaltimes.cn/page/202608/1368694.shtml
- https://peoplesdaily.pdnews.cn/china/er/30052974955
- https://www.earth.com/climate/antarctica-ice-gain-tropical-warm-pool/
- http://english.qdio.cas.cn/newsroom/Headline/202608/t20260824_1188714.html
- https://www.chinadaily.com.cn/a/202608/20/WS6a8675eca3106bc57421c8d1.html
- https://mbiz.heraldcorp.com/article/10859070
- https://www.bignewsnetwork.com/news/279259599/antarctic-ice-sheet-sees-temporary-mass-gain-study
- https://www.youtube.com/shorts/ryr2KSl0CVg
- https://www.sciencedaily.com/releases/2026/09/260906170128.htm
- https://www.bas.ac.uk/news/extreme-heatwave-in-east-antarctica-caused-by-record-breaking-atmospheric-river/
- https://www.lsce.ipsl.fr/en/atmospheric-rivers-in-antarctica/
- https://scripps.ucsd.edu/news/new-study-identifies-atmospheric-rivers-contributor-increased-snow-mass-west-antarctica
- https://www.earth.com/climate/scientists-learn-how-atmospheric-rivers-influence-snowfall-in-antarctica/
- https://www.muser.press/2026/08/31/tropical-heat-slows-antarctic-ice-loss/
- https://iccinet.org/atmospheric-river-creates-record-high-temperatures-and-surface-melt-in-antarctic-peninsula/
- https://insideclimatenews.org/news/12112019/antarctica-ice-shelf-melt-atmospheric-river-thwaites-glacier-ocean-sea-level-rise/
- http://www.szdaily.com/content/2026-09/02/content_32162023.htm
- https://english.cas.cn/newsroom/cas-in-media/202608/t20260821_1188665.shtml
- https://www.ssec.wisc.edu/news/articles/15468
- https://www.chinadaily.com.cn/a/202608/20/WS6a8675eca3106bc57421c8d1.html