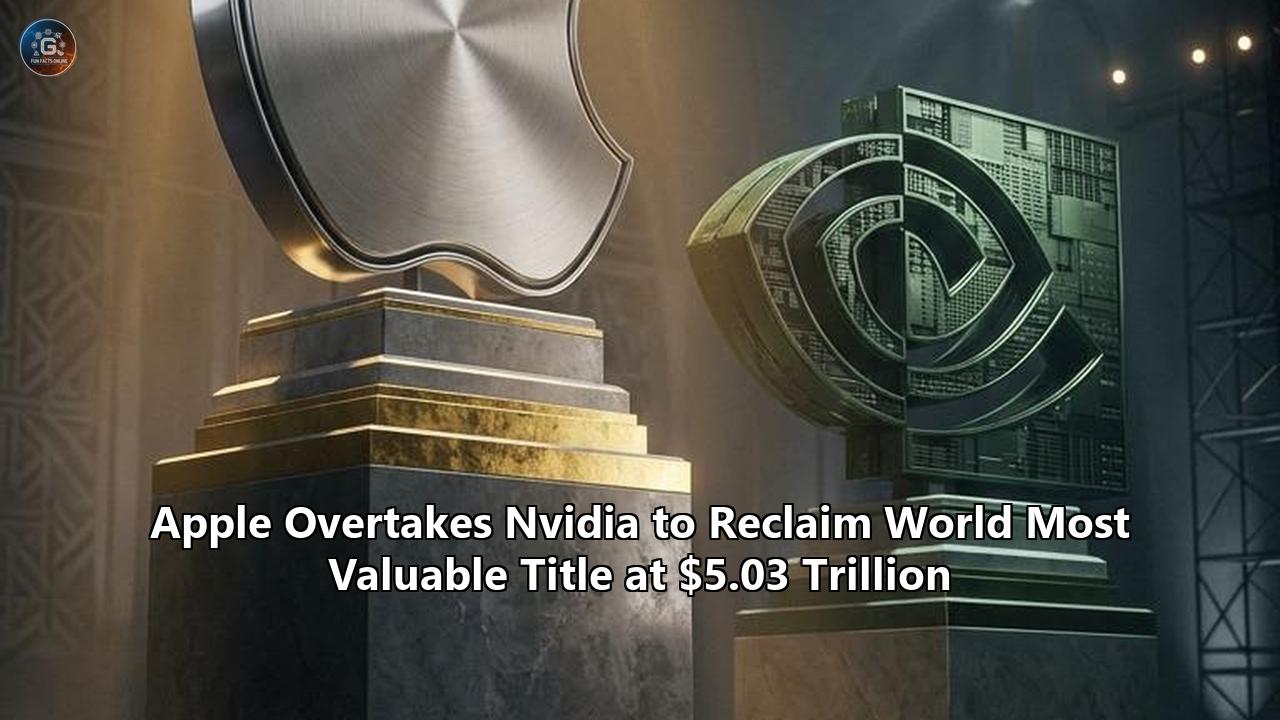
The final bell of the October 30 trading session on Wall Street brought a historic reordering of global corporate dominance. Apple closed with an equity capitalization of $5.03 trillion, surpassing Nvidia to reclaim its standing as the world’s most valuable publicly traded company.
The changing of the guard unfolded during a brutal, broad-scale retreat across the technology sector that wiped out more than $1 trillion in market capitalization from constituents of the Nasdaq-100 in a single trading day. While the tech-heavy Nasdaq Composite dropped 2.86% to 25,437 and the Philadelphia Semiconductor Index plummeted 7.2%, Apple demonstrated defensive durability. Apple shares declined a modest 1.2% to finish at $344.64, whereas Nvidia plunged 4.22% to $204.64, shedding roughly $217 billion in equity value in six and a half hours.
By the final bell, Nvidia’s market capitalization receded to $4.93 trillion, leaving Apple with an approximate $100 billion lead. The reshuffling marks the first time the Cupertino consumer giant has held the undisputed top spot since a brief intraday crossover in late July, cementing a year-to-date share price surge of roughly 27%.
The divergence between the two technology leaders reflects an acute transformation in institutional investor sentiment. Throughout 2024 and 2025, capital rushed unconditionally toward companies producing the physical infrastructure of artificial intelligence, propelling Nvidia past milestones once thought unattainable. Yet late-October earnings reports from Silicon Valley’s largest infrastructure spenders—coupled with disastrous guidance from legacy chipmaker Intel and expanding cash deficits at Amazon—ignited an aggressive market reappraisal. Investors are questioning the commercial payback cycle of hundreds of billions of dollars poured into data centers, high-bandwidth memory, and graphics processing clusters.
In that environment, Apple’s deliberate, capital-light approach to artificial intelligence transformed the stock into an institutional haven. Instead of deploying tens of billions of dollars per quarter into proprietary server farms, Apple leveraged its massive consumer base, internal device engineering, and external foundation model partnerships to harvest AI margins without shouldering hyper-scale depreciation costs. By the final bell, the company's valuation settled at $5.03 trillion, solidifying the Apple market value as the benchmark for corporate capitalization globally.
The $1 Trillion Friday Carnage: Anatomy of an AI Capex Reckoning
The October 30 market retreat was not a standard consolidation; it was a structural liquidation driven by mounting skepticism over enterprise AI monetization. A series of fiscal disclosures delivered after the closing bell on October 29 provided the spark that sent semiconductor and cloud equities tumbling.
Intel delivered the heaviest blow. The legacy semiconductor firm plunged 28.58% in a single session—its most severe one-day collapse since July 1974—wiping out over $140 billion in market value. Intel's fourth-quarter revenue guidance missed consensus projections by more than $1 billion, and Chief Financial Officer David Zinsner confirmed that the company does not anticipate generating positive free cash flow for the fiscal year, citing persistent softness in client computing and severe margin dilution in its contract manufacturing division.
Simultaneously, Amazon rattled credit and equity analysts by disclosing that its trailing 12-month free cash flow swung to a net outflow of $42.4 billion, weighed down by an aggressive escalation in data center buildouts, custom silicon manufacturing, and power utility commitments. That print followed earlier reports from Alphabet and Meta, which experienced monthly share drops of 18.6% and 15.2% respectively after management teams reiterated that capital expenditures would continue expanding through 2027 regardless of immediate revenue realization.
The damage cascaded across the entire semiconductor complex:
- Advanced Micro Devices (AMD) dropped 10.88% as investors questioned enterprise chip order sustainability.
- Qualcomm tumbled 11.12% amid mounting memory pricing headwinds and smartphone chip margin compression.
- Arm Holdings sank 9.97% on concerns over licensing slowdowns for generative compute cores.
- Broadcom fell 5.48%, despite strong custom application-specific integrated circuit (ASIC) revenue.
- Taiwan Semiconductor Manufacturing Company (TSMC) saw its American Depositary Receipts shed 5.95%, pressured by concerns over future foundry capacity utilization.
- Micron Technology fell 5.30%, while South Korea's SK Hynix slid 7.95% on reports of expanding Chinese competition in high-bandwidth memory.
Nvidia sat directly in the crosshairs of this liquidation. While the company remains the primary architect of modern AI accelerator silicon, its fortunes are inextricably tethered to the capital expenditure budgets of four primary hyperscale customers: Microsoft, Meta, Alphabet, and Amazon. Wall Street estimates indicate that the combined AI infrastructure outlays of these four companies will reach roughly $750 billion this calendar year.
However, with capital spending shifting from organic operating cash flows toward long-term corporate debt and specialized credit facilities, fixed-income markets began flashing distress signals. Specialized cloud compute operator CoreWeave, which holds approximately $50 billion in outstanding debt tied to GPU procurement, saw the secondary-market yield on its dollar-denominated notes maturing in October 2031 cross 16%, while credit default swap spreads widened to all-time highs. When debt markets push back against debt-financed silicon purchases, the equity values of semiconductor suppliers inevitably feel the tremors.
Against this backdrop, Apple's 1.2% dip represented genuine relative strength. Rather than chasing the computing buildout through massive infrastructure spending, Apple spent the first nine months of fiscal 2026 generating $117 billion in cash from operations while committing just $6.8 billion to property, plant, and equipment. When institutional capital pulled back from cash-consumptive artificial intelligence plays, it did not move into cash or defensive staples; it rotated directly into Apple's balance sheet.
The Capital Allocation Divide: Asset-Light AI Versus the Server Buildout
The valuation flip between Apple and Nvidia highlights two completely opposing corporate doctrines regarding the AI wave. One model requires building the compute grid; the other controls the ultimate consumer endpoints where that compute is consumed.
       HYPERSCALERS & NVIDIA                APPLE'S ASSET-LIGHT MODEL
┌───────────────────────────────────┐    ┌───────────────────────────────────┐
│ • Combined CapEx: ~$750B / year   │    │ • 9-Mo Property/Equip CapEx: $6.8B│
│ • Massive GPU cluster purchases   │    │ • On-device neural inference      │
│ • High power & land commitments   │    │ • Outsourced cloud intelligence   │
│ • Rapid silicon depreciation      │    │ • Negligible balance sheet debt   │
│ • Diluted Free Cash Flow          │    │ • Projected FCF: $142B (FY26)     │
└─────────────────┬─────────────────┘    └─────────────────┬─────────────────┘
                  │                                        │
                  ▼                                        ▼
   Vulnerable to CapEx Fatigue,             Safe-Haven Capital Magnet,
   Credit Stress & ROI Scrutiny             Defensive Valuation Floor
Nvidia has executed one of the most profitable supply runs in industrial history. Under Chief Executive Officer Jensen Huang, the Santa Clara chip designer achieved operating margins exceeding 60% by establishing an effective monopoly on AI accelerators, high-speed interconnect fabrics like NVLink, and the CUDA software ecosystem. When Nvidia became the first company to reach a $5 trillion market valuation in October 2025, the market was pricing an uninterrupted capital spending supercycle that assumed hyperscalers would double data center investments every two years.
Yet that infrastructure buildout carries structural accounting vulnerabilities that are now emerging on corporate income statements:
- Short-Lived Asset Depreciation: Advanced AI servers and GPUs typically depreciate over three to five years. When a company invests $40 billion in accelerator hardware, that cost is amortized across subsequent quarters, creating substantial non-cash charges against operating profits. If software revenue does not scale quickly enough to offset this rising depreciation, return on invested capital (ROIC) drops sharply.
- Infrastructure Debt Overhang: As hyperscalers and specialized compute providers exhausted their operational cash flows, they turned to commercial paper, corporate bonds, and off-balance-sheet vehicle structures to acquire silicon. Rising corporate bond yields throughout the autumn of 2026 made debt-fueled GPU procurement significantly more expensive.
- Power and Grid Saturation: Physical bottlenecks, including access to high-voltage electrical substations, nuclear power purchase agreements, and liquid cooling systems, began extending data center deployment timelines, slowing the velocity at which chip orders convert into productive enterprise capacity.
Apple rejected this capital-heavy path. Former CEO Tim Cook and current CEO John Ternus structured Apple’s artificial intelligence roadmap around architectural efficiency and edge compute rather than brute-force server scale.
Apple’s intelligence ecosystem relies on a three-tiered compute engine:
- On-Device Neural Engines: Complex operations involving user context, email synthesis, personal data indexing, and image editing are processed locally on the client’s device via dedicated neural processors baked into the A19 Pro and M5 silicon families. These chips draw minimal power, incur zero server hosting fees, and protect user data within device hardware.
- Private Cloud Compute: For queries requiring broader parameter sets, Apple routes encrypted prompts to its proprietary Private Cloud Compute nodes. These servers run entirely on custom Apple Silicon server chips rather than expensive commercial GPU racks, allowing Cupertino to leverage existing internal chip designs and silicon packaging lines.
- Frontier Model Offloading: For unconstrained, open-domain generative queries, Apple externalizes infrastructure costs. Through integration agreements with Alphabet's Google and OpenAI, user queries requiring multi-trillion parameter processing are handed off to external partner ecosystems.
By declining to participate in the data center arms race, Apple kept its capital expenditures at historic lows relative to revenue. While Microsoft, Meta, and Alphabet directed between 25% and 35% of their total revenues directly into capital spending, Apple’s capital expenditures remained below 3% of revenue.
"Wall Street spent eighteen months criticizing Apple for being late to the AI infrastructure buildout," noted Laura Martin, senior entertainment and technology analyst at Needham & Company. "What investors are finally discovering is that Apple did not miss the party; they merely refused to pay for the venue. They let the hyperscalers spend $750 billion proving out foundation models, while Apple preserved its cash and positioned itself as the gatekeeper through which those models must pass to reach 2.2 billion active consumer devices."
The Cash Machine: Deconstructing Apple's $142 Billion Free Cash Flow Surge
The fundamental engine driving Apple’s ascent back to the world's most valuable company is an extraordinary, unmatched volume of cash generation. Consensus estimates from Wall Street project that for fiscal 2026, which concluded on September 30, Apple’s free cash flow reached an unprecedented $142 billion, marking a 38% year-over-year increase.
                     APPLE CASH FLOW & SHAREHOLDER VALUE ENGINE
┌───────────────────────────────────────────────────────────────────────────────┐
│ FISCAL 2026 (PROJECTED) FREE CASH FLOW: $142 BILLION (+38% YoY)               │
├──────────────────────────────────────┬────────────────────────────────────────┤
│ 9-Month Operating Cash Flow: $117.0B │ Property & Equipment CapEx: $6.8B      │
│ Trailing 12-Month FCF:       $136.7B │ Trailing 12-Month Net Income: $128.5B  │
├──────────────────────────────────────┴────────────────────────────────────────┤
│ CAPITAL RETURN EXECUTION:                                                     │
│ • Share Repurchases (9 Months):      $62.1 Billion                            │
│ • Historical Capital Return:         ~$0.97 of every net dollar earned        │
│ • Total Cash & Marketable Securities: $146.5 Billion                          │
│ • Impact: Relentless reduction of outstanding share count, driving EPS        │
└───────────────────────────────────────────────────────────────────────────────┘
A forensic examination of Apple’s regulatory filings illustrates the sheer operational leverage the company achieved across the first nine months of the fiscal year:
- Operating Cash Flow: $117.0 billion generated between October 2025 and June 2026.
- Capital Expenditures: $6.8 billion invested in property, equipment, and production machinery.
- Free Cash Flow: $110.2 billion generated across the nine-month period, expanding to $136.7 billion on a trailing 12-month basis through June.
- Cash Conversion Rate: Free cash flow equaled approximately 106% of reported net income over the preceding four quarters, verifying that accounting profits were matched by liquid cash receipts rather than accrual adjustments or non-cash paper gains.
This financial performance stands in sharp contrast to the liquidity profiles across the rest of the Magnificent Seven. Amazon, which had historically been celebrated for its operational cash flow conversion, experienced negative free cash flow of $42.4 billion over the past 12 months as its aggressive logistics and cloud hardware outlays consumed capital. Alphabet’s free cash flow margins contracted from 24% to under 11%, driven by escalating equipment lease payments and high power utility tariffs.
For equity portfolio managers, Apple’s cash flow profile transformed the stock into an equity bond substitute with growth characteristics. This unprecedented cash flow generation provided bedrock support for the Apple market value, isolating it from the wild valuation multiples rattling speculative tech.
The Share Repurchase Cushion
A critical factor separating Apple from every other mega-cap enterprise is its capital return framework. Over the first nine months of fiscal 2026, Apple directed $62.1 billion toward share repurchases. On a trailing four-quarter basis, repurchases exceeded $82 billion.
Between fiscal 2022 and mid-2026, Apple earned approximately $504 billion in cumulative net income. Over that exact timeframe, the company distributed $72 billion in cash dividends and executed $415 billion in share buybacks, returning roughly 97 cents of every dollar earned directly to shareholders while retaining only $17 billion in cash reserves.
CUMULATIVE CAPITAL ALLOCATION (FY22 – MID-2026):
┌──────────────────────────────────────────────────────────────┐
│ Total Net Income Earned:                      $504 Billion   │
├──────────────────────────────────────────────────────────────┤
│ Cash Dividends Distributed:                  -$72 Billion    │
│ Direct Share Repurchases:                    -$415 Billion   │
│ Net Capital Retained on Balance Sheet:        $17 Billion    │
├──────────────────────────────────────────────────────────────┤
│ Total Cash Returned to Shareholders:          96.6%          │
└──────────────────────────────────────────────────────────────┘
The mathematical consequences of this ongoing capital return program are substantial. By purchasing its own equity on the open market, Apple steadily lowers its total outstanding share count. Even during quarters when headline top-line revenue growth registers in modest single digits, earnings per share (EPS) expand at an accelerated pace.
When technology indices suffered across the semiconductor sell-off, Apple’s constant corporate buyback bid provided support on the open market that Nvidia, despite its own share repurchases, could not match given its higher price-to-earnings multiple and operational reinvestment needs.
Hardware Supercycles: The Foldable Duo and China's 30% Turnaround
Financial engineering alone cannot sustain a $5 trillion enterprise; underlying product revenues must perform. Throughout 2024 and 2025, Wall Street analysts had characterized Apple’s core hardware business as saturated, arguing that global smartphone replacement cycles had stretched beyond 40 months. Those assumptions were dismantled across fiscal 2026.
Over the first nine months of the fiscal year, Apple’s net sales reached $364.4 billion, advancing 16.2% compared to the prior-year period. Driving this expansion was a resurgence in the iPhone division, which accounts for 53.9% of company-wide sales and expanded 22.4% over nine months.
         APPLE REVENUE COMPOSITION (9-MONTH FISCAL 2026)
┌──────────────────────────────────────────────────────────────┐
│ iPhone Hardware:       53.9% ($196.4B)                       │
│ High-Margin Services:  25.2% ($91.8B)                        │
│ Mac & iPad Divisions:  12.6% ($45.9B)                        │
│ Wearables & Home:       8.3% ($30.3B)                        │
└──────────────────────────────────────────────────────────────┘
The Chinese Regional Reversal
The most prominent geographic recovery occurred in Greater China. After three consecutive fiscal years of falling revenue—driven by domestic competitive pressure from Huawei and government office device restrictions—Apple's Greater China revenue surged 30.0% year-over-year.
The rebound was propelled by the iPhone 17 hardware release, which saw significant consumer adoption in tier-one metropolitan areas including Shanghai, Shenzhen, and Beijing. Apple's integration of local AI features through compliance partnerships with regional Chinese technology groups resolved earlier consumer hesitancy. Furthermore, affluent Chinese consumers traded up toward the premium Pro and Pro Max configurations, driving average selling prices (ASPs) well above $1,050.
The iPhone Duo Launch
On October 23, one week prior to Apple regaining the market cap crown, the company executed its most significant hardware launch in years: the retail debut of the iPhone Duo, Apple's inaugural folding dual-display device.
Initial channel checks confirmed rapid sell-outs across physical retail and digital storefronts. Supply chain reports from Taiwan's DigiTimes revealed that Apple instructed primary manufacturing partner Hon Hai Precision Industry (Foxconn) to increase production output for the Duo by 44%, lifting initial manufacturing targets from 9.7 million units to nearly 14 million units through the holiday quarter.
Dan Ives, managing director at Wedbush Securities, noted the immediate market reaction:
"The street was looking for evidence that the folding form-factor was more than a niche category for early adopters. The consumer response to the iPhone Duo proves that when Apple enters a mature hardware segment with proprietary hinge metallurgy, zero display crease, and custom dual-panel software optimization, they redefine the entire segment. We are witnessing the start of an extended hardware upgrade cycle that will carry Apple through fiscal 2027."
Confronting the Global Memory Crunch
This volume expansion occurred despite severe supply-chain headwinds. Throughout 2026, the explosive demand for High Bandwidth Memory (HBM) inside AI server farms created a severe secondary shortage in standard LPDDR5X and enterprise NAND flash memory.
Semiconductor manufacturers pivoted fab lines toward server memory, driving consumer DRAM and NAND pricing upward by more than 35% across the calendar year. In response, Apple took decisive pricing actions. In early summer, the company raised starting prices across select MacBooks and high-end iPad Pro configurations by $100 to $1,000, passing rising bill-of-materials costs onto enterprise and professional buyers.
On smartphones, Apple preserved base pricing on entry-level models to defend market share while widening the price spread on higher-capacity Pro, Pro Max, and Duo models. This operational flexibility preserved corporate gross margins, which held firm between 47% and 48% across the late fiscal quarters.
The Klarna Shift: Transforming Hardware Ownership into Recurring Capital
Beyond component pricing, Apple altered how its hardware is sold in consumer markets. In late July 2026, the company retired its long-running iPhone Upgrade Program and third-party installment structures in the United States, replacing them with a comprehensive leasing initiative called Apple Upgrade, developed in direct partnership with global digital banking provider Klarna.
                     APPLE UPGRADE LEASING STRUCTURE
┌─────────────────────────────────────────────────────────────────────────────┐
│ PARTNER: Klarna Bank AB                                                     │
│ ELIGIBLE HARDWARE: iPhone, Apple Watch, Mac, iPad                           │
├─────────────────────────────────────────────────────────────────────────────┤
│ ENTRY PRICE POINTS:                                                         │
│ • iPhone:      Starting at $17.99 / month (12- or 24-month lease terms)     │
│ • Apple Watch: Starting at $11.99 / month (12- or 24-month lease terms)     │
│ • iPad:        Starting at $11.99 / month (24- or 36-month lease terms)     │
│ • Mac:         Starting at $24.99 / month (24- or 36-month lease terms)     │
├─────────────────────────────────────────────────────────────────────────────┤
│ TERM END OPTIONS:                                                           │
│ 1. Upgrade to latest hardware under new lease term                          │
│ 2. Purchase unit by paying difference between retail price & lease payments │
│ 3. Return hardware to Apple with zero residual obligation                   │
│ 4. Automatic month-to-month extension for up to six months                  │
└─────────────────────────────────────────────────────────────────────────────┘
The financial implications of this program are far-reaching:
1. Insulating Consumers from Price Elasticity
By framing device access around low monthly subscription fees ($17.99 for baseline iPhones, $34.99 for iPhone Pro, and $37.99 for Pro Max), Apple mitigated consumer sensitivity to rising retail price tags caused by memory component inflation. A $1,299 smartphone becomes far more palatable when structured as a predictable recurring utility fee.
2. Balance Sheet De-Risking
Under the Klarna partnership, credit underwriting, payment collection risk, and residual debt accounting are transferred off Apple's financial statements. Klarna conducts soft credit evaluations and manages payment infrastructure, while Apple books upfront device revenue through retail channels upon checkout, shielding its balance sheet from consumer default exposure.
3. Accelerated Hardware Turnover
Traditional retail financing models incentivize customers to keep devices for three to four years until the loan balance clears. Apple Upgrade is engineered for continuous turnover. At the conclusion of a 12- or 24-month lease, users simply return the device to Apple and transition directly to the newly announced model.
This churn provides Apple with a predictable supply of high-grade, pre-owned hardware that feeds its lucrative certified refurbished sales channels across emerging markets in Southeast Asia, Latin America, and India.
4. Expansion of High-Margin Services
Hardware leasing functions as an acquisition vehicle for high-margin Services. Because AppleCare+ was detached from the base lease fee under the new Klarna architecture, Apple rolled out bundled service subscriptions—incorporating AppleCare One, iCloud storage, Apple Music, and Apple Arcade—directly into the checkout flow.
This ecosystem attach rate helped drive Services revenue toward an annualized run rate exceeding $125 billion, posting nearly $32 billion in the final fiscal quarter alone at gross margins topping 74%. Investors reassessing risk found that the Apple market value rested on tangible device shipments and recurring services rather than debt-leveraged data center spending.
The Ternus Era: Engineering Discipline Meets Executive Succession
The late-October valuation milestone serves as a major endorsement for Apple’s executive suite. On September 1, 2026, John Ternus officially assumed the position of Chief Executive Officer, succeeding Tim Cook, who moved to Executive Chair of Apple’s Board of Directors.
The market has historically treated executive transitions at Apple with extreme caution. When Tim Cook took over from Steve Jobs in August 2011, Apple traded at a depressed price-to-earnings multiple of roughly 12 times earnings as analysts doubted an operations expert could maintain the company’s product momentum. Cook silenced those doubts over a 15-year tenure that expanded Apple’s equity valuation from $350 billion to over $5 trillion, establishing the modern consumer supply chain and building the Services division into a Fortune 50 business in its own right.
                          APPLE LEADERSHIP TIMELINE
┌────────────────────────┬────────────────────────┬───────────────────────────┐
│ STEVE JOBS             │ TIM COOK               │ JOHN TERNUS               │
│ 1997 – 2011            │ 2011 – 2026            │ September 1, 2026 – Pres. │
├────────────────────────┼────────────────────────┼───────────────────────────┤
│ • Product Architecture │ • Supply-Chain Mastery │ • Hardware Engineering    │
│ • Graphical User UI    │ • Services Expansion   │ • Silicon Specialization  │
│ • Mac, iPod, iPhone    │ • Wearables (Watch/Pods)│ • Foldables, Vision, AI   │
│ • Val: $0.003T -> $0.35T│ • Val: $0.35T -> $5.0T │ • Val: Overtakes Nvidia  │
└────────────────────────┴────────────────────────┴───────────────────────────┘
The appointment of John Ternus, formerly Senior Vice President of Hardware Engineering, marks a return to an engineer-led corporate structure. Ternus joined Apple’s product design team in 2001 and oversaw engineering across every generation of iPad, the complete transition of the Mac lineup away from Intel processors toward Apple Silicon, and recent iterations of the iPhone and AirPods lines.
Ternus represents a specific balance of engineering depth and operational conservatism:
- Silicon Independence: Ternus was a primary champion of Apple’s custom silicon roadmap. His engineering teams prioritized energy efficiency and local neural processing capability over clock speeds, a design philosophy that proved critical when AI models required deployment on battery-constrained mobile hardware.
- Supply-Chain Continuity: Having worked alongside Cook for more than two decades, Ternus preserved Apple’s strict vendor management practices, resisting long-term take-or-pay silicon contracts at elevated speculative pricing during the peak of the semiconductor shortages.
- Product Innovation: Under his engineering leadership, Apple finalized the hinge mechanics, internal cooling, and structural display architecture that allowed the iPhone Duo to make its debut.
"The seamless nature of this executive transition eliminated what had long been considered an overhang on Apple equity," stated Gene Munster, managing partner at Deepwater Asset Management. "Investors wanted to see whether John Ternus could step into the CEO seat without interrupting operational continuity or alienating Wall Street. Delivering the iPhone Duo launch, maintaining 48% gross margins against component inflation, and overtaking Nvidia within 60 days of taking the corner office answers that question decisively."
The Architecture of Nvidia’s Bottleneck: Concentration Risk and Custom Silicon
To understand how Apple reclaimed the valuation crown, it is equally necessary to analyze the headwinds facing Nvidia. Nvidia's decline from an intraday high market value above $5.4 trillion down to $4.93 trillion highlights specific vulnerabilities in its operational model:
                       NVIDIA'S STRUCTURAL CHALLENGES
┌───────────────────────────────────┬─────────────────────────────────────────┐
│ 1. CUSTOM SILICON DEPLOYMENTS     │ 2. EXTREME CUSTOMER CONCENTRATION       │
│ Hyperscalers expanding internal   │ Over 40% of Data Center revenue relies   │
│ ASICs (Trainium, TPU, MTIA)       │ on just four hyperscalers: Microsoft,   │
│ to cut hardware costs.            │ Meta, Alphabet, and Amazon.             │
├───────────────────────────────────┼─────────────────────────────────────────┤
│ 3. ENTERPRISE FINANCING STRESS    │ 4. MARGIN COMPRESSION RISKS             │
│ Secondary bond yields for compute │ 75%+ gross margins facing pressure      │
│ operators crossing 16%, limiting  │ as customer capex slows and HBM memory  │
│ credit-backed chip purchases.     │ input costs remain elevated.            │
└───────────────────────────────────┴─────────────────────────────────────────┘
1. Hyperscaler Custom Silicon Maturation
For years, hyperscalers had little choice but to purchase Nvidia’s H100, B200, and Blackwell Ultra systems at whatever prices Nvidia demanded, driving Nvidia’s corporate gross margins beyond 75%. In 2026, those customers began deploying internal silicon alternatives at production scale:
- Alphabet shifted massive internal search and recommendation training workloads onto its sixth- and seventh-generation Tensor Processing Units (TPU v6e and Ironium), reducing reliance on commercial GPUs.
- Amazon Web Services (AWS) accelerated deployments of its Trainium3 and Inferentia3 custom silicon, offering substantial cost discounts to cloud developers willing to migrate off Nvidia hardware.
- Meta expanded the footprint of its Meta Training and Inference Accelerator (MTIA) across its family of apps, shifting ranking algorithms away from external accelerator platforms.
- Microsoft began broad-scale server installations of its Maia accelerator line to power core Microsoft 365 Copilot services.
These custom chips do not match Nvidia’s top-tier peak FP8 floating-point computing capabilities across frontier model training. However, they are significantly cheaper to manufacture, consume less power, and are more than adequate for specific inference workloads. As inference volume eclipsed training volume across the global tech stack, the necessity of buying top-of-the-line Nvidia systems for every workload diminished.
2. High Customer Concentration
Despite Nvidia's efforts to diversify into automotive platforms, sovereign national AI initiatives, and industrial robotics, more than 40% of its data center revenue remains concentrated within just four corporate balance sheets: Microsoft, Meta, Alphabet, and Amazon.
When those four corporations signaled during late-October earnings calls that free cash flows had dropped significantly and debt markets were pushing back against unrestrained capital spending, the market had to reconsider Nvidia’s forward revenue multiples.
3. Geopolitical and Memory Supply Limits
Nvidia continues to navigate complex regulatory limits regarding chip performance thresholds and export licenses for international markets, particularly Greater China. Simultaneously, memory suppliers including Micron and SK Hynix prioritized pricing power over unconstrained volume expansion, preventing Nvidia from capturing additional gross profit margins on next-generation rack-scale systems.
Nvidia remains an exceptionally profitable enterprise and the unquestioned performance leader in accelerated computing. Yet when a stock trades at more than 35 times forward earnings, any deceleration in capital expenditure growth rates from its primary customers leads to valuation corrections.
Comparative Financial Matrix: The Titans at $5 Trillion
To visualize the fundamental foundations supporting both corporate giants at this valuation juncture, the following comparative financial metrics contrast Apple and Nvidia as of late October 2026:
| Financial / Operational Metric | Apple Inc. (AAPL) | Nvidia Corporation (NVDA) | Analytical Significance |
|---|---|---|---|
| Market Capitalization | $5.03 Trillion | $4.93 Trillion | Apple leads by ~$100 billion |
| Closing Stock Price (Oct 30) | $344.64 | $204.64 | Apple fell 1.2%; Nvidia fell 4.22% |
| Year-to-Date Share Return | ~27% | ~9.7% to 13.6% | Apple leads Magnificent Seven |
| Trailing 12-Month Net Sales | $466.8 Billion | ~$135.0 Billion | Apple revenue 3.4x larger |
| Fiscal 2026 Free Cash Flow | $142 Billion (est.) | ~$65 Billion | Apple delivers unmatched liquidity |
| 9-Month Physical CapEx | $6.8 Billion | ~$3.2 Billion (Fabless) | Apple capex under 3% of sales |
| Gross Margin Band | 47.0% – 48.7% | 73.0% – 75.5% | Nvidia retains higher product margins |
| Trailing 12-Month Buybacks | $82+ Billion | ~$35 Billion | Apple systematically retires share base |
| Primary Revenue Driver | iPhone Hardware (53.9%) | Data Center Compute (>85%) | Consumer ecosystem vs. Enterprise infra |
| Active Installed Base | 2.2+ Billion Devices | N/A (B2B Infrastructure) | Consumer endpoint lock-in |
| Executive Leadership | John Ternus (CEO) | Jensen Huang (CEO) | Hardware engineer vs. Founder architect |
This matrix illustrates the core tension in modern equity markets. Nvidia maintains superior gross margin and year-over-year revenue velocity within the semiconductor sector. However, Apple commands massive absolute scale, generating over three times the headline revenue and more than double the free cash flow of its Santa Clara counterpart. In periods of macroeconomic stability and credit expansion, markets pay up for Nvidia’s growth rate; in periods of interest rate volatility, tech debt distress, and capex fatigue, markets favor Apple’s cash flow engine.
Portfolio Concentration and the Trillion-Dollar Index Risk
Apple reclaiming the world's most valuable company title at $5.03 trillion is not merely a symbolic milestone for Silicon Valley; it carries heavy systemic implications for the global financial architecture.
The scale of the equity market's top tier has reached unprecedented levels of concentration:
- Apple alone represents roughly 8% of the total weighting of the S&P 500 Index (SPY).
- Apple accounts for nearly 8% of the Nasdaq-100 Index (QQQ).
- Combined with Nvidia, Microsoft, Alphabet, Amazon, and Meta, the top mega-cap tech companies account for over 32% of the entire market capitalization of the S&P 500.
       U.S. EQUITY INDEX WEIGHT CONCENTRATION
┌─────────────────────────────────────────────────────────────┐
│ S&P 500 (SPY):                                              │
│ [████████] Apple Inc. (~8.0%)                               │
│ [████████] Nvidia Corp. (~7.8%)                             │
│ [████████████████████████████████] Mag Seven Total (~32.5%) │
│                                                             │
│ NASDAQ-100 (QQQ):                                           │
│ [████████] Apple Inc. (~8.0%)                               │
│ [████████] Nvidia Corp. (~7.6%)                             │
│ [████████████████████████████████████████] Top 6 (~41.2%)   │
└─────────────────────────────────────────────────────────────┘
This dynamic creates distinct portfolio risks for institutional asset managers, pension systems, and retail investors who hold passive index funds:
1. The Diversification Illusion
Millions of global retirement savers allocate capital monthly into market-cap-weighted index funds under the assumption that they are holding a diversified basket of American enterprise across healthcare, energy, consumer staples, manufacturing, and finance. In reality, nearly one dollar of every three allocated into broad market funds flows directly into the capital spending and hardware cycles of six Northern California and Washington State technology companies.
2. Algorithmic and ETF Liquidity Cascades
Because passive index vehicles and quantitative strategies hold equity proportional to market capitalization, capital inflows automatically purchase Apple and Nvidia shares, regardless of fundamental valuation multiples. Conversely, when an unexpected earnings event triggers institutional rebalancing—as seen during the October 30 session—the forced selling across exchange-traded products causes price disruptions across unrelated sectors, as market makers liquidate liquid mega-cap tech to fund margin requirements or cover derivative exposure.
3. Cash Flow Yield Compression
At an equity valuation of $5.03 trillion, Apple’s trailing free cash flow yield sits below 3%. While exceptional for a business of its size, a 2.7% to 2.9% cash flow yield leaves little margin for operational error when risk-free benchmark 10-year U.S. Treasury notes trade near elevated levels. For the market to sustain a $5 trillion valuation over an extended timeframe, Apple’s cash flow must not merely remain steady—it must compound at double-digit rates year after year.
What Lies Ahead: Key Catalysts and Unresolved Questions
The struggle for market supremacy between Apple and Nvidia remains fluid. With the valuation gap sitting at approximately $100 billion, a single trading session can easily flip the rankings once more. Yet the structural forces that brought Apple back to the top spot will shape the technology landscape through the remainder of the decade.
Looking ahead, several critical milestones and unresolved dynamics will determine whether Apple expands its lead or surrenders the throne:
1. Fiscal Q4 Earnings and Holiday Guidance
Apple is scheduled to publish its fiscal fourth-quarter earnings report on Monday, November 2. Wall Street consensus anticipates revenue of $113.32 billion and earnings per share of $1.98, representing 10.6% revenue growth year-over-year.
However, the primary test for CEO John Ternus will be management's formal guidance for the December holiday quarter (fiscal Q1 2027). The consensus expectation calls for approximately $153.5 billion in revenue, incorporating the initial worldwide retail wave for both the iPhone 17 family and the foldable iPhone Duo. Any sign that component shortages or memory cost inflation are squeezing gross margins could dampen equity sentiment. Looking ahead to fiscal 2027, the trajectory of the Apple market value will hinge on consumer demand durability during the critical holiday quarter.
       UPCOMING CALENDAR: CRITICAL MARKET MILESTONES
┌──────────────────┬──────────────────────────────────────────────────────────┐
│ DATE             │ CATALYST EVENT                                           │
├──────────────────┼──────────────────────────────────────────────────────────┤
│ November 2, 2026 │ Apple reports Fiscal Q4 earnings; provides Q1 guidance   │
│ Mid-Nov 2026     │ Nvidia reports Fiscal Q3 earnings; updates Blackwell mix │
│ December 2026    │ Global retail data on iPhone Duo foldable shipments     │
│ January 2027     │ Hyperscaler FY27 preliminary CapEx budget announcements │
│ Q1 2027          │ Commercial ramp of competing custom ASICs (Trainium/TPU) │
└──────────────────┴──────────────────────────────────────────────────────────┘
2. Nvidia's Fiscal Third-Quarter Response
Nvidia will release its quarterly financial results later in November, providing the definitive counterpoint to the infrastructure spending debate. Investors will scrutinize whether enterprise backlogs for the Blackwell Ultra and Rubin architectures remain intact, whether gross margins can hold the 75% threshold, and whether customer concentration metrics show meaningful diversification beyond the primary four hyperscalers. If Nvidia delivers a beat-and-raise performance that eases Wall Street's capital spending anxieties, the chipmaker could rapidly erase its $100 billion deficit.
3. The Durability of the Hardware Leasing Shift
The long-term success of the Apple Upgrade program with Klarna will take several quarters to fully appear in reported financial statements. Analysts will monitor customer adoption, default rates, and the proportion of customers electing to upgrade their hardware every 12 months versus keeping devices for longer durations. If device leasing successfully flattens smartphone replacement cycles, Apple will have effectively insulated its hardware division from traditional consumer hardware seasonality.
4. Regulatory and Antitrust Headwinds
Both companies face ongoing regulatory scrutiny. Apple continues to manage compliance mandates surrounding app marketplace fees, alternative payment processing, and default search engine revenue-sharing agreements in both the European Union and the United States. Nvidia, meanwhile, faces mounting regulatory review regarding software bundling practices tied to CUDA and its networking hardware acquisitions.
The October 30 market reset represents a pivotal milestone in financial history. When Nvidia surged to a $5 trillion valuation in late 2025, the stock market declared that compute capacity was the most valuable commodity in the digital economy. By elevating Apple back to $5.03 trillion amid an infrastructure sell-off, Wall Street delivered a complementary verdict: building computing infrastructure is powerful, but controlling the consumer ecosystem, generating unencumbered free cash flow, and operating with capital discipline remains the ultimate commercial defense.
As the tech sector adjusts to higher capital costs and scrutinizes artificial intelligence balance sheets, Apple's combination of hardware engineering, recurring subscription services, and relentless share repurchases has once again established the global standard for public enterprise valuation. Whether Apple preserves this lead or trades the crown back to Nvidia, the race between the architects of silicon and the masters of consumer hardware will remain the defining corporate narrative of the decade.
Reference:
- https://finance.biggo.com/news/53826599-84d9-4c23-a257-429f409a6887
- https://tradersunion.com/news/companies/show/4047293-apple-overtakes-nvidia-as/
- https://finance.biggo.com/news/00435927-5c66-49b1-9100-0d727af71bac
- https://www.forbes.com/sites/tylerroush/2026/07/28/apple-briefly-surpasses-5-trillion-market-value-joining-nvidia/
- https://public.com/stocks/nvda/market-cap
- https://www.tradingkey.com/analysis/stocks/us-stocks/262262204-largest-companies-by-market-cap-october-2026-apple-nvidia-microsoft-google-tradingkey
- https://finance.biggo.com/news/3bd9f0af-6901-4e94-9152-87058abad0f1
- https://www.reddit.com/r/stocks/comments/1v9984x/apple_touches_5_trillion_market_cap_for_first_time/
- https://www.thestreet.com/investing/stocks/apple-nasdaq-correlation-earnings
- https://www.techpowerup.com/354347/apple-takes-back-the-top-spot-from-nvidia-after-rough-day-for-ai-stocks
- https://stockanalysis.com/stocks/nvda/market-cap/
- https://www.businessinsider.com/apple-stock-rally-nvidia-selloff-most-valuable-company-market-cap-2026-10
- https://sec-api.io/insights/financial-analysis-august-2026-apple-inc
- https://www.barchart.com/story/news/8528876/apples-iphone-duo-is-likely-to-deliver-growth-acceleration-on-the-back-of-strong-demand
- https://seekingalpha.com/article/4959209-apple-earnings-preview-great-cash-flow-but-347-is-too-expensive
- https://theboringfinanceguy.substack.com/p/apple-the-phone-is-worth-the-price
- https://www.klarna.com/international/press/klarna-to-power-apple-upgrade-a-new-hardware-leasing-program-offered-by-apple/
- https://www.macrumors.com/2026/07/28/apple-upgrade-program-klarna/
- https://www.pcmag.com/explainers/apple-touch-screen-macbook-pro-monthly-cost-apple-upgrade-apple-event
- https://www.macrumors.com/2026/10/14/apple-5-trillion-close/