
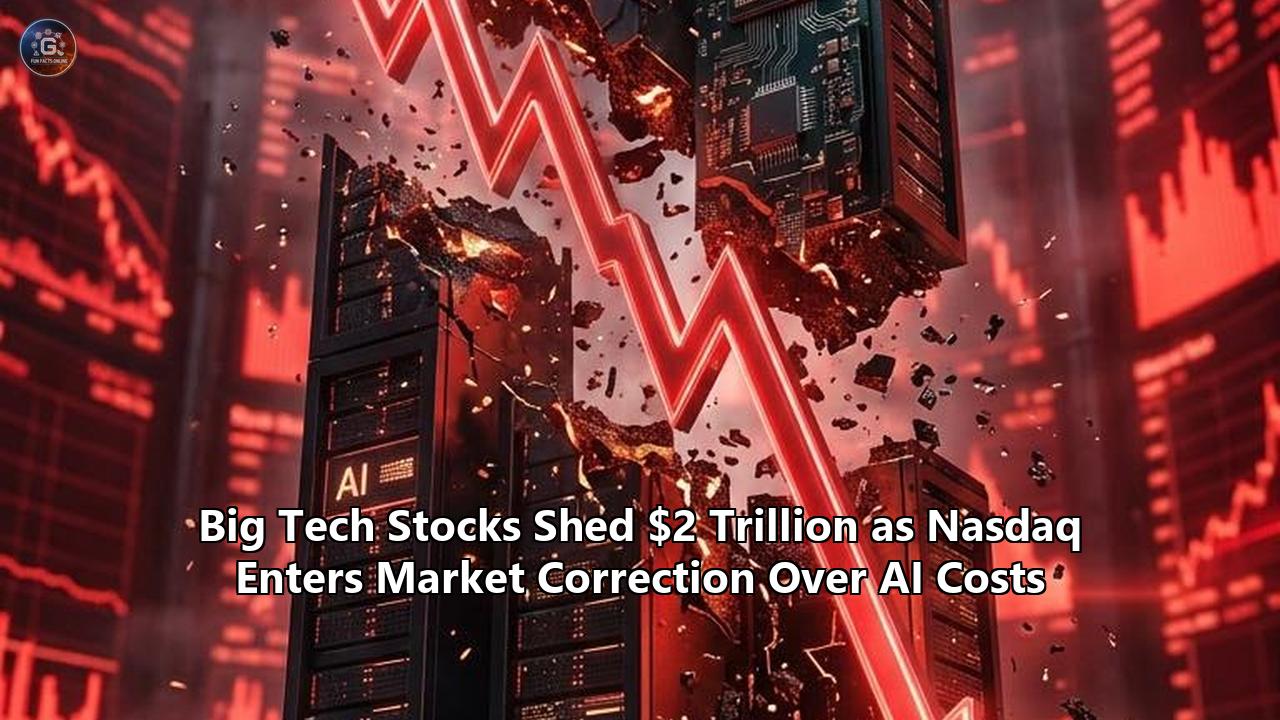
The closing bell at the Nasdaq market site in Times Square offered no sanctuary for equity traders when the tally was finally totaled. Across four volatile trading weeks, the tech-heavy Nasdaq 100 surrendered roughly $2 trillion in market value, descending past the 10 percent drawdown threshold that marks an official market correction. The sell-off was not born of macroeconomic contagion, surprise interest rate hikes, or unemployment spikes; rather, it was sparked by a forensic reckoning with Big Tech’s own balance sheets.
The tipping point arrived as the world’s largest corporate spenders—Alphabet, Microsoft, Amazon, Meta, and Oracle—delivered their quarterly financial reports. Instead of showcasing scalable, high-margin software revenues from generative artificial intelligence, the filings exposed a capital expenditure blitz that has decoupled from commercial reality. Over the trailing twelve months, capital spending among the leading hyperscalers doubled, crossing an annualized run rate of $700 billion and heading toward an estimated $828 billion.
To fund this unprecedented acquisition of silicon, concrete, and electrical infrastructure, the giants did something that shattered their decade-long investment thesis: they burned through their cash reserves, drastically slashed share buybacks, and turned to debt markets. For the first time since 2011, combined capital expenditures among these five companies exceeded the total cash generated by their operations. A collective free cash flow surplus of $143.5 billion from the previous year dissolved into an aggregate cash deficit of $14 billion.
The market response was immediate and merciless. Alphabet suffered a historic single-day collapse, plunging 12 percent and erasing nearly $500 billion in equity value—the second-largest single-session destruction of corporate market capitalization in Wall Street history. Amazon’s disclosure of negative free cash flow sent its shares tumbling, while chip designers and equipment suppliers across the semiconductor supply chain saw their multiples compress overnight.
As the tech stock market correction deepened across institutional trading desks, the narrative that had sustained equities for nearly three years lost its grip. Portfolio managers who had treated mega-cap technology firms as cash-printing monopolies suddenly realized these companies were beginning to behave like capital-intensive, cyclical utilities—sinking hundreds of billions into rapidly depreciating hardware with no clear line of sight to profitable end-user demand.
The Footnote Artifact: How Big Tech Masked $200 Billion in Server Decay
To trace the origins of the sell-off, one must look past the prepared remarks of chief executives and examine the dense, micro-print disclosures buried in the property, plant, and equipment notes of corporate 10-K filings.
Beginning in late 2022 and accelerating through 2024, the major cloud operators quietly enacted an accounting modification that flattered their operating income. Microsoft, Alphabet, Meta, and Oracle systematically extended the estimated useful accounting life of their server and networking hardware from an industry-standard three-to-four years to five or six years.
Hyperscaler Server Depreciation Policies (2020–2025)
┌──────────────┬───────────────────┬───────────────────┬──────────────────────────────┐
│ Company      │ Baseline Schedule │ Revised Schedule  │ Disclosed Annual Pre-Tax Gain│
├──────────────┼───────────────────┼───────────────────┼──────────────────────────────┤
│ Microsoft    │ 4 Years           │ 6 Years           │ ~$3.7 Billion                │
│ Alphabet     │ 4 Years           │ 6 Years           │ ~$3.4 Billion                │
│ Meta         │ 3–4 Years         │ 5.5 Years         │ ~$2.9 Billion                │
│ Oracle       │ 4 Years           │ 6 Years           │ ~$1.2 Billion                │
│ Amazon       │ 6 Years           │ 5 Years (Reversed)│ Negative (Depreciation Drag) │
└──────────────┴───────────────────┴───────────────────┴──────────────────────────────┘
The mechanical effect of this accounting adjustment is simple: by stretching the depreciation of a server over seventy-two months rather than forty-eight, a company reduces its annual recognized depreciation expense on the income statement, artificially boosting reported operating profits without bringing in a single additional dollar of cash. In the initial years following the shift, the disclosed pre-tax benefit surpassed $10 billion across the group.
However, mathematical modeling of the affected asset base reveals a far larger liability. Across the four expanding hyperscalers, net property, plant, and equipment subject to extended schedules stood at approximately $467 billion. Running a traditional four-year counterfactual against projected capital spending between 2026 and 2028 indicates that these companies have collectively suppressed roughly $200 billion in cumulative depreciation.
"It is the oldest balance sheet maneuver in the corporate playbook," explains Robert Simons, an independent forensic accountant and former consultant to institutional short-sellers. "When you are deploying tens of billions of dollars into capital assets every quarter, moving your depreciation schedule by eighteen to twenty-four months acts as an accounting shield. It defers the pain into future reporting periods. But the physical world does not conform to SEC footnotes. High-density graphics processing units do not care about your depreciation assumptions."
In early 2025, the accounting consensus fractured. Amazon broke ranks with its peers, updating its financial disclosures to shorten the depreciable useful life of a subset of servers and networking gear back to five years. Amazon’s filing cited "the increased pace of technological development, particularly in the area of artificial intelligence and machine learning."
Amazon’s reversal exposed the core problem. Unlike traditional central processing units (CPUs) that handle general-purpose enterprise software and can run at modest utilization rates for half a decade, specialized AI accelerator chips—such as Nvidia’s H100, H200, and Blackwell architectures—run under extreme thermal loads. They operate around the clock at near-maximum wattage, enclosed in liquid-cooled chassis designed to extract massive heat.
Silicon engineers familiar with data center hardware stress report that solder joints, memory interfaces, and high-bandwidth interconnects experience severe physical degradation within three to four years of constant training runs. More critically, the rapid cadence of chip architectures renders older hardware economically uncompetitive long before it fails mechanically.
"If an accelerator generation delivers three to four times the performance-per-watt of its predecessor, the cost to run an older cluster on a power-constrained electrical grid quickly exceeds the cost of tearing it out and replacing it," Simons observes. "When you stretch an H100 out to six years on your books, you are telling investors that hardware bought in 2023 will still be commercially productive in 2029. It will not be. When these companies are forced to take accelerated write-downs, that $200 billion depreciation wall is going to hit reported earnings like an avalanche."
The $600 Billion Question: Sequoia’s Arithmetic Catches Up with Wall Street
While depreciation accounting masked infrastructure wear and tear on balance sheets, a separate economic dilemma was festering on the top line: where is the revenue required to justify this build-out?
In late 2023, David Cahn, a partner at venture capital firm Sequoia Capital, published a simple equation that went largely unheeded during the market's initial enthusiasm. Cahn asked how much software revenue the artificial intelligence ecosystem would need to generate to pay for the hardware being deployed. At the time, he pegged the figure at $200 billion annually. By mid-2024, as chip deliveries accelerated, Cahn updated his model and arrived at a far starker conclusion: the tech industry faced an annual $600 billion revenue deficit.
The AI Infrastructure Revenue Gap Formula
┌────────────────────────────────────────────────────────────────────────┐
│ 1. Projected Annualized Nvidia Data Center Revenue:        $150 Billion │
│ 2. Total Cost of Data Center Ownership (TCO Multiple 2x):  $300 Billion │
│    (Includes CPUs, power systems, real estate, cooling)                │
│ 3. Cloud Provider & Developer Margin Recovery (2x Factor): $600 Billion │
│    (Required to maintain standard 50% end-user gross margins)          │
│ ────────────────────────────────────────────────────────────────────── │
│ Total Annual Enterprise Revenue Required:                  $600 Billion │
│ Actual Current Run-Rate AI Software Revenue:               ~$45 Billion │
│ ────────────────────────────────────────────────────────────────────── │
│ Unfunded Annual Economic Deficit:                          $555 Billion │
└────────────────────────────────────────────────────────────────────────┘
The underlying math stems directly from the capital expenditure pipeline. Historically, the purchase cost of compute silicon represents roughly half the total cost of ownership (TCO) for a hyperscale data center; the remainder is absorbed by structural real estate, electrical substations, liquid-cooling distributions, and backup generators.
Furthermore, cloud vendors leasing compute capacity to third-party developers require healthy gross margins to cover their cost of capital, and those developers must turn a profit on their end-user applications. If the semiconductor industry sells $150 billion worth of data center accelerators into the supply chain in a year, the end-user software market must generate roughly $600 billion in high-margin enterprise and consumer value simply to break even.
When institutional investors reconciled that $600 billion requirement against corporate revenue lines during the latest earnings cycle, they discovered a stark shortfall.
Despite ubiquitous deployments and extensive pilot programs across Global 2000 enterprises, genuine generative AI software revenues remain modest:
- OpenAI’s annualized revenue hovered around $4 billion to $5 billion, heavily weighed down by immense compute inference expenses.
- Microsoft reported that its AI services contributed roughly 12 percentage points to Azure’s growth, translating to an annualized run rate near $12 billion—impressive in historical terms, but meager compared to Microsoft's annual infrastructure budget.
- Google Cloud and Amazon Web Services saw incremental annualized gains tied to AI models of less than $10 billion combined.
- Independent enterprise software companies marketing AI add-ons—such as Salesforce, ServiceNow, and Adobe—struggled to demonstrate double-digit adoption rates for their premium AI subscription tiers.
"The enterprise software market simply does not have $600 billion in discretionary software budgets to hand over to LLM providers," says Dr. Aris Thorne, head of technology portfolio strategy at a Boston-based asset management firm managing $85 billion. "Enterprise CIOs operate under strict return-on-investment parameters. In 2023, every board of directors demanded an AI strategy, so procurement teams signed six-figure pilot checks. In 2026, those same boards are asking for productivity gains. When the chief information officer shows them that an AI coding assistant delivers a 3 percent efficiency bump while costing $30 per seat per month, the CFO cancels the expansion."
A private survey of 140 enterprise technology executives conducted in late 2026 by market research firm Foundry revealed that 68 percent of companies had frozen or scaled back their generative AI software deployments, citing uncertain unit economics, security concerns, and model reliability issues. The flood of consumer and enterprise subscriptions needed to close Sequoia's revenue gap has failed to arrive, yet the hyperscalers' capital commitments to Nvidia and hardware supply chains remain locked into long-term contracts.
Circular Capital: Inside the Closed-Loop Financing of AI Compute
As the spread between capital expenditure and customer revenue expanded, investigative scrutiny turned toward the artificial financing mechanisms keeping the ecosystem aloft. SEC filings, venture capital term sheets, and infrastructure supply agreements reveal a web of circular capital transactions among hyperscalers, chipmakers, and foundation model startups.
Rather than reflecting organic end-market demand, a significant share of reported cloud AI growth has been driven by capital recycling schemes:
The Circular Hyperscaler Capital Loop
┌────────────────────────────────────────────────────────────────────────┐
│ 1. Cloud Provider injects billions in equity into AI Startup           │
│    (e.g., Microsoft into OpenAI; Amazon/Alphabet into Anthropic)       │
│                               ▼                                        │
│ 2. AI Startup signs binding contract to spend identical capital back   │
│    on Cloud Provider's computing infrastructure                        │
│                               ▼                                        │
│ 3. Cloud Provider records "explosive" commercial cloud revenue growth  │
│                               ▼                                        │
│ 4. Wall Street assigns premium enterprise valuation multiples          │
│    to Cloud Provider's top-line software expansion                     │
│                               ▼                                        │
│ 5. Chip Designer takes equity in specialty cloud GPU providers         │
│    (e.g., Nvidia into CoreWeave) to secure guaranteed silicon orders   │
└────────────────────────────────────────────────────────────────────────┘
This dynamic is clearly documented in corporate filings. Microsoft’s multibillion-dollar investments into OpenAI were largely distributed not as unrestricted cash reserves, but as computing capacity credits consumed on Microsoft Azure. In turn, OpenAI’s compute expenditures flowed directly back onto Microsoft’s income statement as high-growth, high-margin cloud infrastructure revenue, reinforcing market enthusiasm for Azure’s growth profile.
A similar arrangement unfolded with Anthropic, which raised over $6 billion across multi-tranche commitments from Amazon and Alphabet. The capital injections were paired with commercial agreements requiring Anthropic to utilize AWS and Google Cloud infrastructure, effectively transforming the hyperscalers' venture investments into reported cloud segment revenue.
The circularity extends into specialized cloud operators. CoreWeave, an infrastructure provider that rents GPU clusters, raised billions in debt and equity backed by Nvidia’s preferred silicon allocations. Nvidia itself participated in CoreWeave’s equity funding rounds while providing capacity backstops.
Simultaneously, CoreWeave’s commercial revenue stream was heavily concentrated, with Microsoft accounting for between 62 percent and 67 percent of its total contract backlog. In effect, Microsoft was outsourcing capacity crunches to an entity funded by its primary chip supplier, creating an off-balance-sheet capacity loop that masked true capital commitments.
"It is a hall of mirrors," says Marc Cohodes, a veteran Wall Street short-seller who tracked similar balance-sheet mechanisms during the telecom bubble of the late 1990s. "In 1999, Cisco was vendor-financing startups that had no business model other than buying Cisco routers, which Cisco then booked as revenue.
"Today, the hyperscalers are writing checks to generative AI labs, which immediately wire the money back to the hyperscalers to lease servers packed with Nvidia chips. Everyone books top-line revenue growth, the analysts declare that AI demand is infinite, and the stock multiples expand. But at no point in that transaction has an actual, self-sustaining commercial customer paid for a product."
When sovereign wealth funds and crossover venture investors pulled back from late-stage foundation model funding rounds in mid-2026, the velocity of this circular capital slowed. Cut off from fresh venture cash, model developers were forced to conserve compute, suddenly flattening the cloud consumption metrics that hyperscalers had relied on to justify their capital expansion.
The Physics Wall: How Power Grids and Concrete Broke Software Margins
For three decades, the technology sector enjoyed an unprecedented economic advantage: digital zero marginal cost. Once a software product like Windows, Google Search, or an iOS app was coded, delivering it to a billion users required negligible physical capital. Gross margins regularly exceeded 80 percent, and free cash conversion rates approached 90 percent.
The rapid onset of the tech stock market correction brought an abrupt end to that economic privilege. Generative artificial intelligence is not an asset-light digital service; it is an industrial manufacturing process that operates under the unforgiving constraints of mechanical and civil engineering.
Traditional Enterprise Software vs. Generative AI Infrastructure
┌─────────────────────────────────┬──────────────────────────────────────┐
│ Traditional SaaS / Cloud        │ Hyperscale AI Infrastructure         │
├─────────────────────────────────┼──────────────────────────────────────┤
│ 75%–85% Gross Margins           │ 25%–40% Gross Margins                │
│ Minimal Marginal Server Cost    │ Continuous, High-Wattage Inference   │
│ Standard Commercial Grid Ties   │ Substation Construction & Gas Peakers│
│ Asset-Light Balance Sheets      │ Heavy Industrial PP&E Requirements  │
│ 5–8 Year Equipment Cycles       │ 3–4 Year Thermal & Silicon Decay     │
│ Software-Driven Scalability     │ Physical Grid & Water Bottlenecks    │
└─────────────────────────────────┴──────────────────────────────────────┘
The physical reality has hit hyperscalers across three primary bottlenecks: power interconnection queues, electrical substation backlogs, and water-cooling infrastructure.
In Northern Virginia’s Data Center Alley—the largest concentration of cloud facilities in the world—local utility Dominion Energy informed commercial customers that power requests for AI-ready facilities were outpacing regional grid capacity. Interconnection study queues extended past 2030. In response, technology giants were forced to make massive, long-term capital commitments to secure generation at any price.
The scale of these commitments was underscored when Microsoft struck a landmark twenty-year power purchase agreement with Constellation Energy to revive the decommissioned Unit 1 nuclear reactor at Three Mile Island, rebranded as the Crane Clean Energy Center. Amazon followed by committing $650 million to acquire a nuclear-powered data center campus connected directly to Talen Energy’s Susquehanna facility in Pennsylvania. Alphabet inked deals with advanced nuclear developers to back small modular reactors (SMRs) that will not generate electricity until the 2030s.
"These are not the actions of software companies; these are the actions of aluminum smelters," says Brian Janous, co-founder of Cloverleaf Infrastructure and former vice president of energy at Microsoft. "The market valued these tech companies at thirty-five times earnings because they had clean balance sheets and generated massive free cash flow.
"Suddenly, they are signing twenty-year take-or-pay energy contracts, buying gas turbines, building high-voltage transmission lines, and taking on massive environmental liabilities. When you have to buy the power plant to run the software, your economic profile becomes that of a regulated utility."
The cost of this energy infrastructure has fundamentally eroded the economics of computing. Jim Covello, head of global equity research at Goldman Sachs and an outspoken skeptic of the AI spending boom, systematically challenged the assumption that hardware costs would drop as the technology scaled.
"The tech sector has operated on the blind faith that Moore’s Law will make AI dramatically cheaper over time," Covello wrote in a critical research report. "That is a fundamental misreading of technological history. E-commerce was cheaper from day one. Cloud computing was cheaper than on-premise servers from day one.
"Generative AI is vastly more expensive than the legacy processes it is attempting to replace. Constructing an infrastructure foundation that costs hundreds of billions of dollars to replace work that is currently done by humans earning modest wages is an economic mismatch. Unless AI can solve complex, high-value problems that generate massive revenue, the return on this invested capital will fall far short of the cost of capital."
When the Buyback Spigot Ran Dry: The Anatomy of a Liquidation
For the better part of a decade, Wall Street relied on a steady institutional backstop: Big Tech's share buyback machine. Faced with mounting cash piles and few regulatory paths for large-scale acquisitions, Apple, Alphabet, Microsoft, and Meta spent hundreds of billions of dollars repurchasing their own shares. These buybacks systematically reduced share counts, buoyed earnings per share, and provided algorithmic support during equity downturns.
As capital expenditure exploded in late 2026, that support vanished.
A comprehensive analysis of corporate cash-flow statements and LSEG financial data across the five dominant tech conglomerates reveals that share repurchases fell by an astonishing 83 percent year-over-year. In the first nine months of the year, the group spent just $13.6 billion buying back their own stock, down from $81.8 billion in the identical period the year prior. Alphabet and Meta, which had deployed a combined $66.5 billion into share repurchases over the first three quarters of 2025, completely halted buyback operations in 2026.
Capital Allocation Shift: Hyperscaler Cartel (9M 2025 vs. 9M 2026)
┌──────────────────────────────────────────────┬──────────────┬──────────────┐
│ Metric (Combined Totals: MSFT, GOOGL, AMZN,  │ 9M 2025      │ 9M 2026      │
│ META, ORCL)                                  │              │              │
├──────────────────────────────────────────────┼──────────────┼──────────────┤
│ Operating Cash Flow                          │ $420.8B      │ $542.9B      │
│ Capital Expenditures (PP&E Additions)        │ $277.3B      │ $556.9B      │
│ ──────────────────────────────────────────── │ ──────────── │ ──────────── │
│ Net Free Cash Flow                           │ +$143.5B     │ -$14.0B      │
│ Capital Returned to Shareholders (Buybacks)  │ $81.8B       │ $13.6B       │
│ Capital Return as Share of Operating Cash    │ 27.4%        │ 9.3%         │
│ Corporate Bond Issuances & AI Paper          │ $12.0B       │ $97.0B+      │
└──────────────────────────────────────────────┴──────────────┴──────────────┘
The capital that had once supported equity prices was redirected directly into data center supply chains. To plug the resulting cash-flow deficits, tech companies turned to the corporate bond market.
Meta priced a record-setting $30 billion investment-grade bond issue while structuring a $27 billion off-balance-sheet special purpose vehicle (SPV) to finance its hyperscale data center builds. Alphabet raised $56 billion across back-to-back bond offerings, Amazon added nearly $40 billion in long-term debt, and Microsoft finalized plans for a $25 billion corporate offering.
For institutional allocators, this signaled a structural regime change. Long-only asset managers, sovereign wealth funds, and systematic quant funds were suddenly holding companies with rising leverage, shrinking free cash flow, and declining capital return programs.
"Institutional investors own Big Tech because these companies are supposed to be free cash flow machines that return capital systematically," says Elena Rostova, a quantitative portfolio manager at an institutional investment fund in Zurich. "When you halt your buybacks, take on $30 billion in corporate debt, and announce that your capital expenditures will outstrip your cash flow for the next eight quarters, you are no longer a growth-at-a-reasonable-price asset.
"You have morphed into an industrial utility that is issuing debt at a 5 percent cost of capital to purchase short-lived tech hardware that depreciates at 25 percent per year. The institutional models instantly signaled a sell. That is what triggered the tech stock market correction."
Once the selling started, systematic risk models compounded the downturn. Commodity trading advisors (CTAs) and risk-parity strategies were forced to unwind leveraged long positions as volatility spiked, turning orderly earnings revaluations into an institutional liquidation that swept across the Nasdaq 100.
Dissecting the Casualties: When Earnings Calls Lost Their Scripts
The market rout was not uniform; it was a targeted repricing of the companies showing the deepest cash-flow strain. A forensic review of earnings disclosures reveals how the narrative unravelled across the sector's bellwethers:
Alphabet: The $500 Billion Flash Crash
On October 29, 2026, Alphabet published quarterly earnings that triggered the worst single-day market wipeout in its history as a public company. The headline numbers showed overall revenue growth of 13 percent, but institutional analysts quickly spotted alarming figures in the granular segment data.
Alphabet's quarterly capital expenditure climbed past $50 billion, pushing free cash flow to negative $9.1 billion. More concerning was the performance of its core advertising business.
Search advertising revenue growth decelerated, driven by lower revenue per query on searches utilizing the company's generative "AI Overviews" and conversational search modes. While running an AI search query cost Alphabet roughly four times more in electricity and computing cycles than a traditional keyword search, the company was monetizing that query with fewer commercial ad clicks.
In a single trading session, Alphabet’s stock plunged more than 12 percent, vaporizing $500 billion in market value. Over the course of the call, executives repeatedly declined to specify when AI Search investments would yield margin parity with legacy search, leaving analysts to conclude that Alphabet was effectively subsidizing an expensive technology to defend its core monopoly against competitors.
Amazon: The AWS Cash Drain
At Amazon, the pressure point appeared in its cash flow statement. While Amazon Web Services posted a 37 percent year-over-year revenue expansion, capital expenditures ballooned to an unprecedented $151 billion over trailing twelve-month periods.
Amazon was spending $1.70 in capital expenditure for every single dollar of operating cash flow generated across its entire business—including its retail, cloud, and advertising divisions.
The result was a quarterly free cash flow deficit that deteriorated past $34 billion. Investors who had relied on AWS to self-fund Amazon’s global logistics operations discovered that, for the first time in corporate history, the retail and advertising segments were being tapped to subsidize an aggressive infrastructure build-out for AWS customers, compressing consolidated returns.
Microsoft: The Azure Growth Bottleneck
Microsoft’s earnings call offered a different version of the same dilemma: capital expenditure ran far ahead of physical capacity. The company revealed capital additions exceeding $30 billion for the quarter, yet growth in its core Azure cloud business slowed slightly from the previous period.
CFO Amy Hood acknowledged that despite spending tens of billions on data center real estate, server clusters were constrained by a lack of data center space and grid interconnections, preventing the company from meeting immediate enterprise capacity requests.
Investors were caught in a double bind: Microsoft was burning cash at a historic rate, yet physical infrastructure constraints were preventing that capital from translating into near-term cloud revenue. The stock sold off as Wall Street revised down its return on invested capital (ROIC) forecasts through 2028.
Meta: Building Infrastructures for Unclear Markets
Meta’s quarterly update brought a familiar sense of capital expansion without commercial clarity. The company raised its capital expenditure budget guidance past $75 billion, even as its revenue base remained almost entirely dependent on digital advertising auctions across Facebook, Instagram, and WhatsApp.
Mark Zuckerberg defended the spending, telling analysts that failing to secure computing capacity early presented an existential risk, and that over-investing was far preferable to under-investing.
However, unlike Microsoft and Amazon, which lease excess compute capacity to third parties, Meta has no enterprise cloud business to monetize its vast GPU clusters. The infrastructure was being built to train open-source models, leaving analysts with no clear model for how the company would recover its capital costs. Meta shares dropped over 8 percent in after-hours trading.
The Academic Consensus: An Economic Impact Problem
The market's sudden shift away from generative artificial intelligence is rooted in a fundamental macroeconomic reality that academic economists had been warning about for over a year.
In a landmark research paper published by the National Bureau of Economic Research (NBER), Daron Acemoglu, Institute Professor of Economics at MIT and Nobel Laureate in Economics, published an exhaustive study on the potential productivity and GDP impacts of generative AI over the next decade. Acemoglu's findings directly contradicted Wall Street’s aggressive projections.
Acemoglu calculated that generative artificial intelligence would affect no more than 5 percent of all economic tasks across the United States economy over the next ten years. Even after accounting for aggressive technological advances, Acemoglu concluded that the technology would lift total U.S. GDP growth by only 0.93 percent to 1.56 percent over an entire decade—amounting to an incremental annual growth bump of just 0.1 percent to 0.15 percent.
"A tremendous amount of corporate spending is being allocated based on the assumption that these models can automate complex decision-making and cognitive labor," Acemoglu says. "In reality, the current architecture of large language models is fundamentally optimized for prediction and pattern matching within existing linguistic datasets.
"They excel at summarizing documents, generating preliminary code snippets, and managing basic customer interactions. But the vast majority of high-value corporate labor involves contextual problem-solving, situational judgment, and physical coordination. Generative AI is not designed to solve those problems. When you spend trillions of dollars automating tasks that represent a sliver of enterprise costs, the aggregate economic return is bound to disappoint."
Acemoglu’s research highlights the fundamental disconnect that triggered the sell-off:
- High Automation Costs: Sinking $100,000 in capital expenses per worker into data center infrastructure to automate customer service or copyediting generates a negative net present value compared to employing human labor.
- Low Task Complexity: Tasks effectively automated by generative AI tend to be low-wage, non-critical enterprise workflows with low pricing power.
- Severe Liability and Error Rates: Hallucinations, copyright litigation risks, and regulatory data sovereignty compliance impose significant risk premiums that prevent enterprises from removing human oversight, wiping out anticipated cost savings.
When enterprise buyers recognized that these systems augmented human workers rather than replacing them outright, they recalibrated their willingness to pay. Software providers that had planned to charge hundreds of dollars per seat for AI agents found themselves renegotiating contracts down to single digits, crushing the revenue projections that supported Big Tech's early valuations.
Parallels of Excess: The 1870s, 2001, and the Cycle of Infrastructure Busts
The spectacle of a technology index shedding trillions of dollars over infrastructure costs is not without historical precedent. The trajectory of the current tech stock market correction closely mirrors the great infrastructure expansions of the past: the transcontinental railroad mania of the 1870s and the telecommunications fiber-optic boom of the late 1990s.
Historical Parallels of Infrastructure Bubbles
┌──────────────────────┬──────────────────────┬──────────────────────────────────┐
│ Era & Technology     │ Primary Overbuild    │ The Inevitable Correction        │
├──────────────────────┼──────────────────────┼──────────────────────────────────┤
│ 1870s: Railroads     │ Parallel Track Lines │ Panic of 1873; 89 Railroads Bank-│
│                      │ Across the US Plains │ rupted; Rail Network Inherited   │
├──────────────────────┼──────────────────────┼──────────────────────────────────┤
│ 1990s: Telecom Fiber │ Transatlantic Cables │ Dot-Com Crash of 2001; Global    │
│                      │ & Terabit Networks   │ Crossing Bankrupt; Dark Fiber    │
│                      │                      │ Lit a Decade Later at 90% Off    │
├──────────────────────┼──────────────────────┼──────────────────────────────────┤
│ 2020s: AI Hardware   │ High-Density GPU     │ Hyperscaler CapEx Cutbacks;      │
│                      │ Clusters & Nuclear   │ Server Depreciation Acceleration;│
│                      │ Energy Microgrids    │ Repricing of Silicon Multiples   │
└──────────────────────┴──────────────────────┴──────────────────────────────────┘
Between 1996 and 2001, telecommunications companies like Global Crossing, WorldCom, and Qwest raised and deployed hundreds of billions of dollars to lay millions of miles of dark fiber across the globe. The underlying thesis was entirely correct: the internet was a transformative technology that would ultimately carry all human commerce, entertainment, and communication.
Yet the financial timing was a disaster. Network operators laid transoceanic cables capable of transmitting terabits of data at a time when commercial bandwidth demand grew in mere megabits.
Over 95 percent of the installed optical fiber sat unlit in the ground. When capital markets realized that the timeline to monetize this infrastructure spanned decades rather than quarters, the telecommunications sector collapsed, erasing over $2 trillion in equity value and triggering widespread insolvencies.
The dark fiber laid during the late 1990s was not dismantled. Following bankruptcies that wiped out debt and equity holders, the physical fiber was acquired for pennies on the dollar by upstart operators. A decade later, that very network carried the streaming video and cloud services that made YouTube, Netflix, and modern smartphones viable businesses.
"The builders of infrastructure rarely capture its economic value," notes financial historian Dr. Kenneth Reich. "The investors who funded the canals, the early railways, and the transatlantic cables lost their shirts. The economic surplus was captured twenty years later by the businesses that utilized that overbuilt, commoditized infrastructure at near-zero cost.
"The hyperscalers are spending hundreds of billions building out data centers, purchasing chips, and contracting power grids. If history is any guide, these facilities will eventually be utilized, but only after their current capital cost has been thoroughly written off, clearing the path for the actual applications to be built profitably on cheap, commoditized compute."
What to Watch: Catalysts and Fault Lines Ahead
As institutional allocators navigate the aftermath of the tech stock market correction, the focus on trading desks has shifted from model parameters and benchmark demonstrations to forensic corporate metrics. Several critical checkpoints over the coming quarters will determine whether the market finds an economic floor or enters a deeper capital winter:
- Depreciation Revisions in Annual 10-K Filings: Watch whether Microsoft, Alphabet, Meta, and Oracle follow Amazon's lead and shorten their server depreciation schedules from six years back to four or five. An accounting retreat will immediately reduce consensus operating profit forecasts by billions of dollars across the tech sector.
- Enterprise Software Contract Renewals: As initial two- and three-year enterprise software agreements signed at the height of the 2023 generative AI boom approach expiration, contract renewal rates and per-seat license expansion metrics will reveal whether corporate buyers are finding tangible value or shedding unused licenses.
- The Secondary Market for Accelerator Silicon: A reliable leading indicator of infrastructure oversupply will emerge in the broker market for rented compute. If hourly spot pricing for H100 and Blackwell clusters on secondary cloud exchanges continues to drop, hyperscalers will face margin erosion in their compute leasing segments.
- Credit Spreads on Tech Corporate Debt: Big Tech’s bond issuances have so far been absorbed smoothly by credit markets. If credit rating agencies or fixed-income investors begin demanding wider spreads to fund debt-fueled infrastructure builds, the cost of capital for these facilities will rise, forcing management teams to prune capital spending.
- Nvidia's Order Backlog and Guidance: As the ultimate supplier in the infrastructure chain, any commentary from Nvidia regarding hyperscaler capital spending delays or inventory digestion will signal whether cloud operators have begun pulling back on their silicon commitments.
The initial era of the artificial intelligence boom—defined by narrative optimism, balance-sheet maneuvers, and an unchecked capital spending cycle—has run its course. Wall Street’s $2 trillion market correction was not a rejection of artificial intelligence as a long-term technology, but an institutional declaration that the rules of corporate finance have not been rewritten.
So long as the technology industry demands trillions of dollars in physical capital outlays, it will be held accountable to the cold, unforgiving arithmetic of corporate cash flows. Silicon Valley has built the physical engine of the future; now, it must prove that anyone can afford to pay for the ride.
Reference:
- https://techvera.online/ai-capex-boom-nasdaq-2-trillion-selloff-2026/
- https://www.financialexpress.com/market/global-markets/nasdaq-faces-2-trillion-wipeout-how-ai-spending-is-eating-into-big-tech-investor-returns/4373671/
- https://a47news.ai/story/business/47569/tech-stocks-decline-amazon-intel-earnings
- https://siliconanalysts.com/analysis/hyperscaler-ai-capex-depreciation-wall-2026
- https://www.businessinsider.com/amazon-alphabet-meta-microsoft-spacex-capex-ai-spending-total-2026-10
- https://finance.biggo.com/news/748225f9-5606-4d99-a0ba-26b60aceb60d
- https://footnotebrief.com/hyperscaler-depreciation-ai-capex-circularity/
- https://seekingalpha.com/article/4960584-buy-the-hyperscaler-panic
- https://sequoiacap.com/article/ais-600b-question
- https://www.statista.com/chart/35046/capital-expenditure-of-meta-alphabet-amazon-and-microsoft/
- https://www.goldmansachs.com/images/migrated/insights/pages/gs-research/gen-ai--too-much-spend%2C-too-little-benefit-/TOM_AI%202.0_ForRedaction.pdf
- https://truenorthinstitute.com/resource/eden-mccallum-and-lord-adair-turner-net-zero-2024-perspective/
- https://research.contrary.com/report/too-much-spend-too-little-benefit