Imagine standing on the deck of a ship in the middle of a tempest, staring down at the churning ocean, and trying to determine if the global sea level is rising by a few millimeters. You would be blinded by the towering swells, the crashing whitecaps, and the deep troughs of the waves. The sheer chaos of the immediate environment would completely obscure the slow, silent, and steady rise of the water beneath you.
This is the exact dilemma climate scientists face when looking at Earth’s atmosphere. Our planet's climate system is a chaotic, noisy, and dynamic engine, prone to wild short-term swings and dramatic regional fluctuations. Yet, beneath the roar of daily weather, seasonal shifts, and cyclical ocean currents, a profound and dangerous shift is occurring: anthropogenic global warming. To see this underlying trend clearly, researchers cannot simply look at a thermometer on a hot summer day. They must employ a specialized, highly rigorous field of study known as statistical climatology.
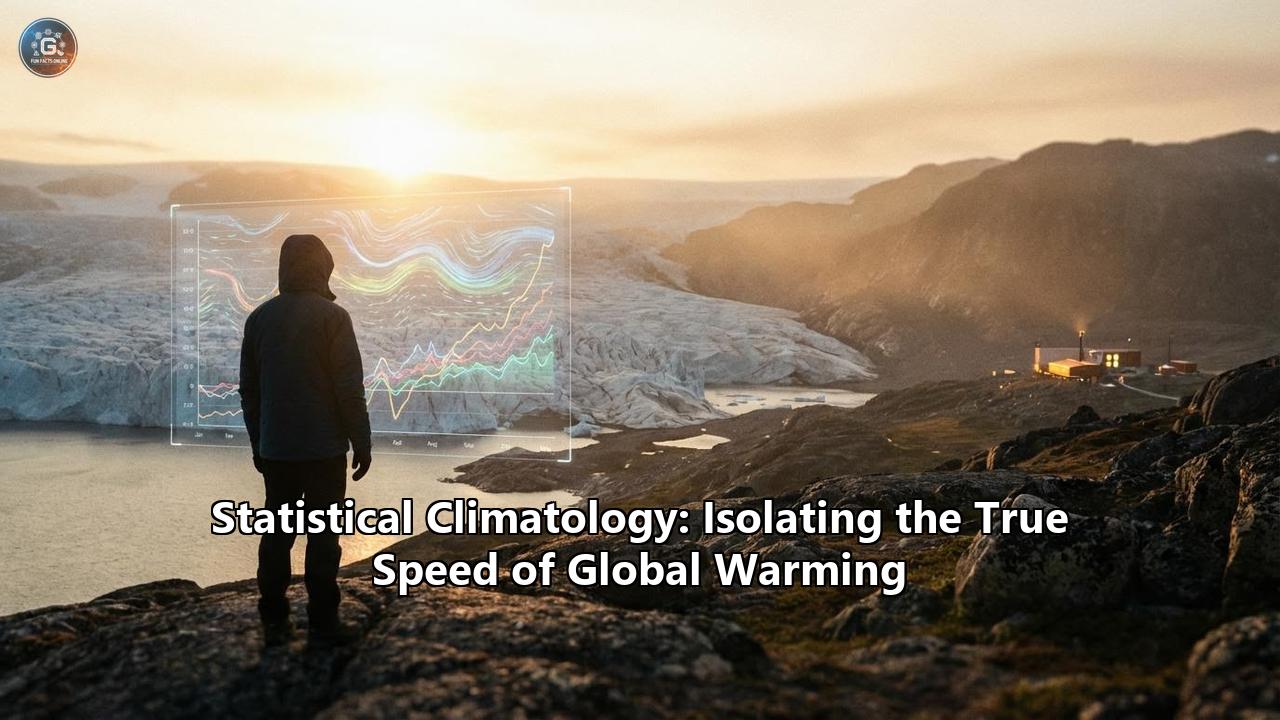
Statistical climatology is the mathematical sieve used to filter out the "noise" of natural climate variability to reveal the "signal" of human-caused climate change. By applying advanced statistical methods to vast datasets of historical temperatures, ocean heat content, and atmospheric composition, scientists can isolate the true speed of global warming. And recently, this mathematical discipline has revealed a startling truth: the steady warming we observed for decades has shifted gears. The planetary train is accelerating.
The Symphony of Signal and Noise
To understand how statisticians isolate the true speed of global warming, one must first understand what they are trying to strip away. The Earth's climate has always been driven by the balance of incoming and outgoing energy, and long before the industrial revolution, the planet experienced massive natural climate cycles.
In statistical climatology, this natural variability is considered "noise" when trying to measure the "signal" of human-caused warming. If you look at a simple line graph of global average temperatures from 1850 to the present, the line does not move upward in a perfectly smooth, straight diagonal. Instead, it jaggedly zigzags up and down, featuring years that are suddenly cooler than the last, followed by years that shatter heat records.
These zigzags are primarily driven by four natural phenomena:
1. The El Niño-Southern Oscillation (ENSO):This is the most prominent source of short-term climate noise. ENSO is a recurring climate pattern involving changes in the temperature of waters in the central and eastern tropical Pacific Ocean. During an El Niño phase, the ocean releases massive amounts of stored heat into the atmosphere, causing a temporary spike in global surface temperatures. Conversely, during a La Niña phase, the ocean absorbs excess heat, plunging cold water to the surface and temporarily cooling the global average. These cycles typically occur every two to seven years.
2. Volcanic Eruptions:When massive volcanoes erupt, they inject millions of tons of sulfur dioxide high into the stratosphere. These sulfur aerosols act like a planetary sunshade, reflecting incoming solar radiation back into space. The result is a distinct, measurable cooling of the Earth's surface that can last for two to three years. Historical eruptions like Mount Pinatubo in 1991 temporarily masked the underlying warming trend.
3. Solar Variability:The sun operates on roughly an 11-year cycle of activity, transitioning from solar minimums to solar maximums. While the fluctuation in total solar irradiance is relatively small (about 0.1%), it is enough to create tiny ripples in the global temperature record. However, highly precise satellite measurements since 1978 have shown no long-term upward trend in solar activity, unequivocally ruling out the sun as the driver of modern global warming.
4. Decadal Ocean Oscillations:Beyond the short-term ENSO cycle, the oceans possess longer-term rhythmic shifts, such as the Pacific Decadal Oscillation (PDO) and the Atlantic Multidecadal Oscillation (AMO). These phenomena can rearrange heat across the planet over periods of 20 to 30 years. During certain phases, they can bury heat deep in the ocean, causing surface warming to appear as though it has slowed; in other phases, they release heat, making surface warming appear to accelerate.
Because these natural variations exist on time scales of several years to decades, the shorter the time span of the data record you examine, the more difficult it is to separate systematic, human-driven changes from natural fluctuations.
The Mathematical Sieve: Tools of the Trade
How do scientists isolate the true anthropogenic trend from this cacophony of natural cycles? It requires far more than calculating simple averages. Statistical trend estimation methods are highly developed and account for the peculiar, complex aspects of climate data, such as non-Gaussian distributional shapes and temporal autocorrelation (the fact that today's weather is highly dependent on yesterday's weather).
Multiple Linear and Non-Linear RegressionAt its most basic level, trend analysis involves regression—fitting a line or curve to a time series to determine the rate at which temperature changes over a specific period. However, simple linear regression assumes a steady rate of change. Because greenhouse gas emissions have grown exponentially rather than linearly, climatologists often employ non-linear regression, quadratic trend analysis, or piecewise linear models (which can identify specific moments or "change-points" where the rate of warming suddenly shifts).
Filtering out the ForcingsTo find the true speed of warming, scientists use multi-variate mathematical models to subtract the known influences of ENSO, volcanoes, and the sun from the temperature record. By assigning a quantifiable temperature value to a specific ENSO index (like the multivariate ENSO index) or to stratospheric aerosol optical depth (for volcanoes), statisticians can literally erase these natural events from the historical timeline. What is left behind is the underlying, long-term warming signal.
Low-Frequency Component Analysis (LFCA)Historically, separating natural variability from global warming required running incredibly complex, computationally expensive global climate models on supercomputers numerous times with minor perturbations. However, recent advancements in statistical climatology have introduced more elegant mathematical solutions. For example, a method called Low-Frequency Component Analysis (LFCA) sorts modes of variability based on their dominant time scales. It distinguishes global warming from natural fluctuations based entirely on differences in temperature patterns and time scales, allowing scientists to separate phenomena like the Pacific Decadal Oscillation from human-caused warming without relying solely on physics-based computer models.
The Myth of the "Hiatus"
The absolute necessity of statistical climatology was brought to the forefront of public consciousness during the late 1990s and 2000s. In 1998, a spectacularly powerful El Niño event caused global temperatures to spike dramatically. In the years following 1998, as the Pacific Ocean shifted into a prolonged La Niña-dominant phase and the solar cycle dipped, global surface temperatures did not rise as sharply as they had in the preceding decade.
Climate skeptics and bad-faith actors seized upon this raw data to declare that global warming had "paused" or stopped entirely. This alleged "hiatus" became a major political talking point, used to delay climate action and cast doubt on the reliability of climate science.
However, statistical climatology proved the hiatus was an illusion. When statisticians placed proper error bars on the data and applied trend estimation methods, they demonstrated that the underlying warming trend had not stopped at all. The "pause" only seemed to exist when cherry-picking 1998—an anomalous, El Niño-fueled outlier—as the starting point of the graph. Furthermore, when statisticians filtered out the cooling effects of the negative ENSO phase and minor volcanic activity of the 2000s, the human-caused warming signal was revealed to be chugging along exactly as greenhouse gas physics dictated. There was no basis to infer a global warming hiatus; it was merely hidden behind the large error bars of natural variability.
The 2026 Revelation: A Speeding Train
If the early 2000s taught us the danger of confusing natural cooling with a halt in global warming, the data of the mid-2020s has delivered the inverse lesson. In 2023, 2024, and 2025, global temperatures shattered historical records by terrifying margins. According to NOAA's annual climate reports, 2024 was the warmest year since global records began in 1850 by a wide margin, sitting 2.62°F (1.35°C) above the pre-industrial average. The ten warmest years in the historical record have all occurred in the past decade.
But a crucial question emerged in the scientific community: Were these record-breaking years simply the result of a steady, linear warming trend being temporarily amplified by the strong 2023-2024 El Niño? Or had the underlying speed of global warming actually accelerated?
In March 2026, a landmark, peer-reviewed study published in the journal Geophysical Research Letters provided the definitive, statistically confirmed answer. Led by prominent climate scientists and statisticians, including Stefan Rahmstorf from the Potsdam Institute for Climate Impact Research (PIK) and U.S. statistics expert Grant Foster, the research team delivered a stark warning to humanity.
For the first time, scientists were able to state with over 98 percent statistical confidence that global warming is not merely continuing at a steady pace—it is accelerating.
To arrive at this conclusion, the researchers applied their mathematical filters to five of the world's most widely used global temperature datasets: NASA, NOAA, the UK Met Office's HadCRUT5, Berkeley Earth, and the Copernicus ERA5. They painstakingly removed the short-term natural influences—the recent El Niño, the current solar maximum, and volcanic activity. They utilized both quadratic trend analysis to measure the curve of the warming signal, and piecewise linear models to pinpoint exactly when the rate of global warming changed noticeably.
The results were undeniable, consistent across all five independent datasets, and independent of the analysis method chosen.
Between 1970 and 2015, the Earth's average global temperature rose at a fairly steady rate of just under 0.2°C per decade. However, the data revealed a dramatic shift occurring between late 2013 and early 2014. From 2015 onward, the planet departed from its previous, slower path. In the decade leading up to 2025, the underlying rate of warming nearly doubled, surging to an estimated 0.35°C per decade.
Crucially, the study proved that this acceleration was not a mirage caused by the unusually hot years of 2023 and 2024. Even after mathematically filtering out the El Niño heat that fueled those specific years, the underlying long-term trend remained significantly steeper than in any previous decade on record. As Grant Foster explained, "We filter out known natural influences in the observational data, so that the 'noise' is reduced, making the underlying long-term warming signal more clearly visible".
Fingerprinting the Culprit: How We Know It’s Us
While filtering out natural noise reveals the speed of warming, another branch of statistical climatology works alongside atmospheric physics to prove the source of the warming. Differentiating anthropogenic drivers from natural drivers relies on identifying distinct spatial and temporal "fingerprints" left behind in the climate system.
If the recent acceleration in warming were caused by a sudden, unseen increase in solar radiation, the laws of thermodynamics dictate that the entire atmosphere would warm uniformly—from the surface troposphere up through the stratosphere. However, observations show the exact opposite. The troposphere (the lower layer of the atmosphere where we live and where greenhouse gases accumulate) is warming rapidly, while the stratosphere above it is simultaneously cooling. This divergent temperature profile is the exact, exclusive fingerprint of the greenhouse effect: gases like carbon dioxide are trapping outgoing heat near the surface, depriving the upper atmosphere of that energy.
Furthermore, statistical analysis of atmospheric chemistry definitively links this trapping of heat to the burning of fossil fuels. Scientists measure the isotopes of carbon in the atmosphere. Fossil fuels are derived from ancient, fossilized plants, which prefer to absorb the lighter Carbon-12 isotope rather than the heavier Carbon-13. Furthermore, because fossil fuels are millions of years old, all their radioactive Carbon-14 has long since decayed.
Statistical analysis of modern air samples shows that total CO₂ is rising precisely as the ratio of Carbon-13 to Carbon-12 is falling, and as the concentration of Carbon-14 is being diluted. This phenomenon, known as the Suess effect, provides unassailable, mathematical proof that the excess carbon driving global warming is ancient, plant-based carbon unleashed by human industrial activity.
The Implications of a Speeding Train
The revelation that the true speed of global warming has nearly doubled to 0.35°C per decade carries immense and immediate consequences for global policy and human survival.
Under the 2015 Paris Climate Accord, the international community pledged to pursue efforts to limit the global temperature increase to 1.5°C above pre-industrial levels. It is important to note that breaching this target refers to an average temperature increase sustained over 20 years, not just a single anomalous year like 2024. However, the fact that individual years are now routinely brushing past the 1.5°C mark is an early, blaring alarm bell.
With the underlying rate of warming now statistically confirmed at 0.35°C per decade, the mathematical reality is stark. As climate scientist Stefan Rahmstorf noted following the release of the 2026 findings, if this newly accelerated pace is sustained, the Earth is on track to permanently exceed the 1.5°C limit of the Paris Agreement before the year 2030. This is several years earlier than the most pessimistic estimates produced by standard climate models just a decade ago.
The cause of this recent acceleration is the subject of intense, ongoing research. Many scientists theorize that we are paradoxically suffering the consequences of our own success in fighting traditional air pollution. New international shipping regulations implemented in 2020 drastically reduced the amount of sulfur aerosols emitted by cargo ships. Because these aerosols acted as artificial "volcanoes" that reflected sunlight and temporarily masked greenhouse warming, their sudden removal from the atmosphere may have unmasked the true, terrifying potency of the carbon dioxide we have accumulated. Additionally, natural feedback loops—such as the rapid decline of reflective sea ice in the Arctic (which replaces white, heat-reflecting ice with dark, heat-absorbing ocean water)—are amplifying the warming rate.
Conclusion: The Numbers Do Not Lie
Human beings are narrative creatures, often swayed by our immediate senses. A cold winter storm or a rainy summer can easily trick the human mind into doubting the reality of global climate change. We look at the churning, chaotic waves of the daily weather and struggle to perceive the rising tide beneath them.
This is why statistical climatology is not merely an academic exercise; it is the most vital lens through which we can perceive the reality of our planet's shifting mechanics. By stripping away the distracting rhythms of El Niño, the temporary chill of volcanic ash, and the subtle heartbeat of the sun, statisticians have forced us to look at the raw, unadorned truth.
The truth is no longer hidden behind natural variability or mathematical error bars. The underlying signal of anthropogenic climate change is clear, it is monotonic, and as the latest data from 2026 definitively proves, it is accelerating. The math has been done. The noise has been filtered. The true speed of global warming is now known, and the window to apply the brakes is closing faster than we ever calculated.
Reference:
- https://pollution.sustainability-directory.com/term/statistical-climatology-methods/
- https://www.latimes.com/environment/story/2026-03-08/earth-is-warming-faster-than-previously-estimated-new-study-shows
- https://www.sciencedaily.com/releases/2026/03/260309183208.htm
- https://energyeducation.ca/encyclopedia/Natural_vs_anthropogenic_climate_change
- https://www.giss.nasa.gov/research/briefs/archive/2008_delgenio_05/
- https://pcc.uw.edu/research-abstracts/6676-2/
- https://www.researchgate.net/post/What_are_the_most_reliable_methods_to_differentiate_anthropogenic_and_natural_drivers_of_global_warming
- https://pmc.ncbi.nlm.nih.gov/articles/PMC2752544/
- https://www.researchgate.net/publication/329578038_Trend_analysis_of_climate_time_series_A_review_of_methods
- https://climatedataguide.ucar.edu/climate-tools/trend-analysis
- https://time.com/7382950/climate-change-speeding-up-science/
- https://www.carbonbrief.org/pace-of-global-warming-has-nearly-doubled-since-2015-study-says/
- https://www.climate.gov/news-features/understanding-climate/climate-change-global-temperature